Lottery Master Class

ii
Contents
1 Legal Notice and Disclaimer 1
2 Part I: Foundations 3
2.1 Chapter 1: Introduction . . . . . . . . . . . . . . . . . . . . . . . . . . 3
2.2 Chapter 2: A History of the Lottery . . . . . . . . . . . . . . . . . . . . 4
2.2.1 Ancient and early origins . . . . . . . . . . . . . . . . . . . . . . 4
2.2.2 The lottery in England and colonial America . . . . . . . . . . . . 4
2.2.3 Prohibition and revival . . . . . . . . . . . . . . . . . . . . . . . 4
2.2.4 The multi-state and digital eras . . . . . . . . . . . . . . . . . . . 5
2.2.5 Lotteries around the world today . . . . . . . . . . . . . . . . . . 5
2.3 Chapter 3: How a Modern Lottery Actually Works . . . . . . . . . . . . 5
2.3.1 Draw mechanisms . . . . . . . . . . . . . . . . . . . . . . . . . . 5
2.3.2 Where the money goes . . . . . . . . . . . . . . . . . . . . . . . 6
2.3.3 Pari-mutuel versus fixed prizes . . . . . . . . . . . . . . . . . . . 6
2.4 Chapter 4: The Games . . . . . . . . . . . . . . . . . . . . . . . . . . . 7
2.4.1 Daily numbers games: Pick 3 and Pick 4 . . . . . . . . . . . . . . 7
2.4.2 Pick 5 . . . . . . . . . . . . . . . . . . . . . . . . . . . . . . . . . 7
2.4.3 6-number lotto games (e.g., 6/49, 6/42, provincial and national lotto) . . 7
2.4.4 Mega Millions and Powerball . . . . . . . . . . . . . . . . . . . . 8
2.4.5 Keno . . . . . . . . . . . . . . . . . . . . . . . . . . . . . . . . . 8
2.4.6 Instant games (scratch-offs) . . . . . . . . . . . . . . . . . . . . 8
2.4.7 A summary odds table . . . . . . . . . . . . . . . . . . . . . . . . 9
3 Part II: The Mathematics, plainly 11
3.1 Chapter 5: Combinations and Why They’re the Whole Story . . . . . . 11
3.2 Chapter 6: Reading an Odds Table Without Being Fooled by It . . . . . 11
3.3 Chapter 7: Expected Value – What Every Dollar Actually Returns . . . 12
3.4 Chapter 8: Independence and Why the Past Tells You Nothing . . . . . 13
3.5 Chapter 9: Prize Splitting – The Hidden Variable . . . . . . . . . . . . 13
4 Part III: Systems 15
4.1 Chapter 10: Wheeling . . . . . . . . . . . . . . . . . . . . . . . . . . . 15
4.1.1 Full wheels . . . . . . . . . . . . . . . . . . . . . . . . . . . . . . 15
4.1.2 Abbreviated wheels . . . . . . . . . . . . . . . . . . . . . . . . . 16
4.1.3 What a wheel guarantee actually means (and doesn’t) . . . . . . 16
iii
4.1.4 A minimal example: the 3-if-6-in-12 wheel . . . . . . . . . . . . . 16
4.2 Chapter 11: Key Numbers . . . . . . . . . . . . . . . . . . . . . . . . . 17
4.3 Chapter 12: Frequency Analysis – Hot and Cold Numbers . . . . . . . 17
4.4 Chapter 13: Filters . . . . . . . . . . . . . . . . . . . . . . . . . . . . . 18
4.5 Chapter 14: Delta Systems, Decade Reduction, and Positional Play . . . 18
4.6 Chapter 15: Full-Coverage Play – Playing All the Numbers in Well-
Constructed Combinations . . . . . . . . . . . . . . . . . . . . . . . . . 19
4.6.1 The construction . . . . . . . . . . . . . . . . . . . . . . . . . . . 19
4.6.2 So what does the structure actually buy you? . . . . . . . . . . . 20
5 Part IV: What’s Real and What Isn’t 21
5.1 Chapter 16: Things That Feel Like Edges But Aren’t . . . . . . . . . . . 21
5.2 Chapter 17: Things That Actually Are Edges . . . . . . . . . . . . . . . 22
5.2.1 Rollover timing . . . . . . . . . . . . . . . . . . . . . . . . . . . 22
5.2.2 Unpopular-combination selection . . . . . . . . . . . . . . . . . . 22
5.2.3 Syndicate leverage . . . . . . . . . . . . . . . . . . . . . . . . . 22
5.2.4 Tax and payout structuring . . . . . . . . . . . . . . . . . . . . . 23
5.3 Chapter 18: The Strongest Move Nobody Sells You – Playing Less . . . 23
5.4 Chapter 19: Trading Chances Across Draws . . . . . . . . . . . . . . . 23
5.5 Chapter 20: Variance Shaping . . . . . . . . . . . . . . . . . . . . . . . 24
6 Part V: Practice 25
6.1 Chapter 21: Lottery Software – What It Does, What It Can’t, and How
to Evaluate a Vendor . . . . . . . . . . . . . . . . . . . . . . . . . . . . 25
6.1.1 What legitimate lottery software does . . . . . . . . . . . . . . . 25
6.1.2 What no legitimate software does . . . . . . . . . . . . . . . . . 25
6.1.3 Red Flags when evaluating a vendor . . . . . . . . . . . . . . . . 26
6.1.4 Software for full-coverage and wheel construction, generally . . 26
6.2 Chapter 22: Syndicates . . . . . . . . . . . . . . . . . . . . . . . . . . 26
6.3 Chapter 23: Bankroll and Budget Discipline . . . . . . . . . . . . . . . 27
6.4 Chapter 24: Martingales and Chase Systems . . . . . . . . . . . . . . . 27
6.5 Chapter 25: If You Win . . . . . . . . . . . . . . . . . . . . . . . . . . . 28
6.5.1 The First hours . . . . . . . . . . . . . . . . . . . . . . . . . . . . 28
6.5.2 Anonymity by jurisdiction . . . . . . . . . . . . . . . . . . . . . . 28
6.5.3 Lump sum versus annuity . . . . . . . . . . . . . . . . . . . . . . 29
6.5.4 Taxes . . . . . . . . . . . . . . . . . . . . . . . . . . . . . . . . . 29
6.5.5 Advisers . . . . . . . . . . . . . . . . . . . . . . . . . . . . . . . 29
7 Glossary of Lottery Terms 31
8 Reference Tables 35
8.1 Odds by game (approximate, 2026) . . . . . . . . . . . . . . . . . . . . 35
8.2 Full-wheel sizes (6-number games) . . . . . . . . . . . . . . . . . . . . 35
8.3 Full-wheel sizes (5-number games) . . . . . . . . . . . . . . . . . . . . 35
9 Resources 37
9.1 Oficial lottery operators . . . . . . . . . . . . . . . . . . . . . . . . . . 37
9.2 Mathematics and combinatorics . . . . . . . . . . . . . . . . . . . . . . 37
iv
9.3 Player communities and news . . . . . . . . . . . . . . . . . . . . . . . 38
9.4 Problem gambling support . . . . . . . . . . . . . . . . . . . . . . . . . 38
9.5 A note on this book’s own sourcing . . . . . . . . . . . . . . . . . . . . 38
10A Final Word 39
v
vi

Legal Notice and Disclaimer
This book is sold for entertainment and educational purposes only. Nothing in it constitutes financial, legal, tax, or gambling addiction counseling advice, and no combination of numbers, wheeling pattern, filter, or piece of software described here changes the probability of any single lottery drawing. Lottery drawings are independent random events; each drawing has no memory of the ones before it.
Odds, prize structures, and game formats mentioned in this book were accurate as of early 2026 but are set by lottery operators and change periodically. Always confirm current rules, odds, and prize structures with your own state, provincial, or national lottery operator before playing.
If playing the lottery is causing you financial hardship, or if you feel unable to stop, help is available. In the United States, call or text the National Problem Gambling Helpline at 1-800-MY-RESET (1-800-697-3738), available 24/7. The older 1-800-522-4700 number also still connects to the same network. Comparable helplines exist in most countries; a lottery retailer or your lottery’s own website can usually point you to one.
Play only with money you have already budgeted for entertainment, never with money earmarked for bills, savings, or debt.
Part I: Foundations
Chapter 1: Introduction
You have probably read a headline like one of these:
A retired teacher in Ohio wins $60 million on a single Mega Millions ticket.
A construction worker in Arkansas claims a quarter-billion-dollar Powerball jackpot.
A woman in Illinois wins $340,000 on a state cash game she has played for years.
Stories like these are why lotteries exist, and why more than a billion tickets are sold every week around the world. They are also, almost without exception, stories about people who bought a ticket like anyone else and had a random machine or a random number generator happen to favor them. That is not a satisfying thing to hear, and it is not what most lottery books tell you. Most lottery books tell you about a “system,” a piece of “software,” a set of “secret patterns” that, once you understand them, will move you from the group of people who lose to the group of people who win.
This book is going to tell you the truth about that promise, and then it is going to spend most of its pages on something more useful: what genuinely does and does not affect your results, how the mathematics of these games actually works, what the various number-selection systems can and cannot do, how to evaluate the software sold to automate them, and — a subject almost no lottery book covers honestly — how playing less, playing differently timed, or not playing at all can be worth more to you than most of the prizes you will ever win.
If you are looking for a formula that beats the odds, put this book down; no such formula exists, and anyone who tells you otherwise is selling you something. If you are willing to understand a genuinely fascinating area of mathematics, get real, unglamorous value out of your lottery budget, and avoid the traps that catch most players, keep reading.
Chapter 2: A History of the Lottery
Ancient and early origins
Games of chance involving drawn lots are older than written history, and something close to a lottery — the distribution of land or property by lot — appears in the Hebrew Bible. Roman emperors, including Augustus, used lotteries to distribute property and slaves at banquets, and the Chinese Han Dynasty is sometimes credited with a keno-like game used to help finance the Great Wall, though the historical record for that claim is thin and largely legendary rather than documented.
The lottery in something closer to its modern cash-prize form is usually traced to fifteenth-century Burgundy and Flanders, where towns held public lotteries to raise money for fortifications and aid to the poor. The word “lottery” itself is generally believed to derive from the Middle Dutch loterije, related to lot (“fate”), or from the Italian lotto, meaning much the same thing. Florence held a lottery with cash prizes in 1530, and the practice spread through the Italian city-states over the following century.
The lottery in England and colonial America
Queen Elizabeth I chartered the first English state lottery in 1566–69, with prizes that included cash, plate, and tapestries, and roughly 400,000 tickets were sold. Lotteries became a standard tool of English public finance for the next century, funding everything from harbor works to, in 1612, the Virginia Company’s settlement at Jamestown — meaning a lottery helped bankroll the first permanent English colony in North America.
Lotteries remained central to early American public finance for two centuries after that. The Continental Congress attempted to run a lottery to help fund the Revolutionary War. Between the 1790s and the mid-1800s, lotteries funded roads, bridges, canals, and a striking number of American universities, including Harvard, Yale, Princeton, and Columbia, all of which received early lottery-funded income.
Prohibition and revival
The nineteenth century turned against lotteries. Scandals — most notoriously the Louisiana State Lottery Company, a private operation so corrupt and so dominant in mailing tickets nationwide that Congress banned the use of the U.S. mail for lottery materials in 1890 — combined with a broader moral reform movement to drive lotteries out of American life almost entirely by 1900. Canada similarly restricted lotteries under its Criminal Code.
The modern revival began in 1964, when New Hampshire launched the first legal state lottery in the U.S. in the twentieth century, explicitly to raise revenue without a general tax increase. New York followed in 1967, New Jersey in 1970, and by the mid-1970s more than a dozen states had lotteries, most earmarking proceeds for education. Canada’s Criminal Code was amended in 1969 to permit lotteries run by charities and, later, provincial governments, leading to the creation of the modern Canadian lottery corporations.
The multi-state and digital eras
Individual state games had an obvious limitation: jackpots were capped by how many people could play. The solution was pooling. Multi-state games began in the 1980s, and Powerball (originally Lotto*America) launched in 1988 as a joint game among a handful of states, later expanding nationwide. What is now Mega Millions began in 1996 as “The Big Game” among six states. Both games have had their number matrices — the range of numbers players choose from — enlarged several times since, each enlargement making the jackpot odds longer and the jackpots themselves correspondingly larger and more headline-grabbing.
The internet changed distribution and information rather than the games’ basic mathematics: results became instantly checkable worldwide, subscription and courier services emerged to let people buy tickets in jurisdictions they don’t live in (where legal), and, in some jurisdictions, direct online ticket sales became possible. It also gave rise to an entire secondary industry: lottery prediction software, wheeling programs, and paid “systems,” which is a central subject of this book.
Lotteries around the world today
Lottery operators today exist on every continent except Antarctica. The World Lottery Association, the industry’s global trade body, counts member lotteries across roughly 80 countries. National games vary widely in format, prize structure, and regulation:
United Kingdom — The National Lottery, established by the National Lottery etc. Act 1993, runs Lotto (a 6/59 game as of its most recent format change) and participates in EuroMillions, a shared game among the UK and several European countries.
Canada — Lotto 6/49, launched in 1982, was Canada’s first nationwide lottery game and remains a staple; Lotto Max, a 7/50-style game, now carries Canada’s largest jackpots.
Australia — State-based operators (the Lott, Tatts) run Saturday Lotto, Oz Lotto, and Powerball (an Australian game unrelated to the American one).
Spain — El Gordo de la Primitiva and the Christmas-season El Gordo de Navidad draw, one of the largest total prize pools in the world, are cultural institutions rather than just games.
Continental Europe — EuroMillions and EuroJackpot are the two major shared multinational games, each pooling ticket sales and jackpots across a dozen or more countries.
Regulation, taxation, minimum playing age, and whether winners’ identities are made public all vary sharply by jurisdiction — a subject this book returns to in Chapter 25.
Chapter 3: How a Modern Lottery Actually Works
Draw mechanisms
Most traditional lottery draws still use mechanical ball machines: a chamber of numbered balls, air-mixed and drawn one at a time, often broadcast or recorded on video specifically so the process is independently verifiable. Powerball, Mega Millions, and most state 6/xx games use this method. Some games — particularly daily numbers games and many online-only or international games — use certified random number generators (RNGs) instead, audited by independent testing labs and gaming commissions.
Both methods are subject to security auditing, and both have, rarely, been defeated by insiders — most infamously the 2015 Iowa “Hot Lotto” fraud, in which a lottery security director rigged an RNG to predict a jackpot draw. That case is why modern lotteries invest heavily in independent oversight, dual-custody procedures for drawing equipment, and surprise audits. For an ordinary player, the drawing mechanism can be treated as genuinely random; the fraud risk that exists is an institutional one, not something a player’s number selection can protect against or exploit.
Where the money goes
A useful way to think about a lottery ticket is as a voluntary, heavily regressive tax with a lottery attached. A typical U.S. state lottery return breaks down roughly as follows, though exact figures vary by game and jurisdiction:
45–65% returned to players as prizes
20–30% to the state or beneficiary (education, general revenue, etc.)
10–15% retailer commissions and operating costs
Multi-state games like Powerball and Mega Millions typically return around 50–55% of sales to prizes over time, though the effective return on any single ticket varies enormously with the jackpot size, because a large share of the “prize pool” concept only pays out fully when the jackpot is won.
Pari-mutuel versus fixed prizes
This distinction matters more than most players realize:
Fixed-prize games pay a set dollar amount per prize tier regardless of how many other people also win that tier. Most scratch-off games and many daily numbers games are fixed-prize.
Pari-mutuel games split a fixed pool of prize money among however many winners there are at each tier. Powerball and Mega Millions are pari-mutuel below the jackpot tier (both currently guarantee a $1 million non-jackpot prize as a fixed floor, with other tiers scaled by a multiplier feature) and always pari-mutuel at the jackpot level — if two tickets match all numbers, they split the jackpot.
Pari-mutuel structure is the mechanism behind one of the genuinely useful ideas in Part IV of this book: because your payout at a shared tier depends on how many other people picked the same numbers, which numbers you pick — not how likely they are to be drawn, which is identical for all combinations — can change your expected payout.
Chapter 4: The Games
Daily numbers games: Pick 3 and Pick 4
Pick 3 and Pick 4 are run by nearly every U.S. state lottery, usually with two draws a day. Players choose 3 or 4 digits, each from 0–9, and can typically bet several ways:
Bet type Description Approx. odds (Pick 3) Approx. odds (Pick 4)
Straight Digits must match in exact order 1 in 1,000 1 in 10,000
Box (3-way) Any order; two digits identical (e.g. 1-1-2) 1 in 333 —
Box (6-way) Any order; all digits distinct 1 in 167 1 in 417
Box (4-way) Pick 4, one pair repeated (e.g. 1-1-2-3) — 1 in 833
Combo Plays all straight permutations of a set of digits Cost scales with permutations
Cost scales with permutations
Straight odds are simple: with 10 digits and 3 or 4 positions, there are 10^3 = 1,000 or 10^4 = 10,000 equally likely outcomes. Box bets pay less because they win more often — the payout is reduced roughly in proportion to how many orderings would win.
Pick 5
A middle-tier game format, typically a single matrix of around 35–45 numbers from which 5 are drawn, no bonus ball. Because there’s no second pool, the mathematics is simple combinations. A 5-from-39 format (used by several U.S. state “Take 5”-style games) has:
⇒ C(39,5) = 575,757 possible combinations
6-number lotto games (e.g., 6/49, 6/42, provincial and national lottos)
The classic format worldwide: choose 6 numbers from a pool, typically 42 to 49. Canada’s Lotto 6/49 and the UK’s Lotto (historically 6/49, now 6/59) are the best-known examples. The jackpot odds for a 6/49 game:
⇒ C(49,6) = 13,983,816 possible combinations ≈ 1 in 14 million
Mega Millions and Powerball
These are the two U.S. multi-state “jumbo jackpot” games, each drawn twice a week and each combining a large primary matrix with a smaller secondary ball.
Powerball, as of 2026: choose 5 numbers from 1–69, plus one
Powerball from 1–26. Ticket price $2 ($3 with the Power Play multiplier add-on).
⇒ C(69,5) × 26 = 11,238,513 × 26 = 292,201,338 ≈ 1 in 292.2 million
Mega Millions, as of its April 2025 format change: choose 5 numbers from 1–70, plus one Mega Ball from 1–24. Ticket price $5, which now automatically includes a built-in prize multiplier (2X–10X) on non-jackpot tiers.
⇒ C(70,5) × 24 = 12,103,014 × 24 = 290,472,336 ≈ 1 in 290.5 million
Both games’ odds have lengthened over the years as their matrices grew — a deliberate design choice by the operators, since longer odds mean jackpots roll over more often and grow larger, which drives ticket sales far more than a modest, frequently-won prize does.
Keno
A fast-draw game (often every few minutes) where the operator draws 20 numbers from a pool of 80, and the player picks anywhere from 1 to 10 (or more, depending on the jurisdiction) numbers in advance, hoping to match as many as possible. Keno odds and payouts vary enormously by how many “spots” the player picks; it is structurally closer to a casino game than to a jackpot lottery, with much better player-side transparency into the payout table but generally poor overall return.
Instant games (scratch-offs)
Pre-printed tickets with a fixed, audited number of winning tickets seeded into a fixed print run. Odds are disclosed on the back of the ticket or the game’s official odds sheet, and — unlike a drawn game — the true odds change slightly as a specific print run sells down and its remaining winning tickets are depleted or (rarely) tracked publicly by some state lotteries. Because a scratch-off’s odds are fixed by print run rather than reset every draw, higher-price instant games generally offer a meaningfully better overall return to player than low-price ones, though still well under 100%.
A summary odds table
Game Matrix Jackpot odds (approx.)
Pick 3 (straight) 3 digits, 0–9 1 in 1,000
Pick 4 (straight) 4 digits, 0–9 1 in 10,000
Pick 5 (5/39 style) 5 of 39 1 in 575,757
6/42 lotto 6 of 42 1 in 5,245,786
6/49 lotto 6 of 49 1 in 13,983,816
Mega Millions 5/70 + 1/24 1 in 290,472,336
Powerball 5/69 + 1/26 1 in 292,201,338
Part II: The Mathematics, Plainly
Chapter 5: Combinations and Why They’re the Whole Story
Almost every serious claim in this book rests on one idea from combinatorics: the combination formula.
⇒ C(n,k) = n!/k!(n-k)!
This counts how many ways you can choose k items from a pool of n, where order doesn’t matter and you can’t repeat an item. A lottery drawing — 6 balls drawn without replacement from 49, say — is precisely this kind of event, which is why C(49,6) = 13,983,816 is the number of equally likely outcomes for a 6/49 draw.
The word “equally likely” is doing all the work in that sentence, and it’s worth sitting with. Every one of those 13,983,816 combinations — 1-2-3-4-5-6 included — has exactly the same probability of being drawn as any other. The machine or algorithm that draws the numbers has no concept of which combinations “look like” a lottery number and which look suspiciously orderly. This single fact is the reason most of the “systems” covered in Part III cannot change your odds of winning the jackpot, and it’s worth remembering every time a piece of software or a book chapter implies otherwise.
Chapter 6: Reading an Odds Table Without Being Fooled by It
Lottery marketing loves to describe the overall odds of winning something — Powerball advertises roughly 1-in-25 overall odds, for instance — right next to the jackpot odds, in a way that makes the game feel far more winnable than it is. The overall odds figure is technically accurate and almost entirely irrelevant to you, because it’s dominated by the lowest prize tier (in Powerball’s case, matching just the Powerball number, worth $4 — a break-even-ish “prize” against a $2 or $3 ticket, not a win in any meaningful sense).
When you see an odds table, separate it mentally into three questions:
What are the odds of the jackpot? (The number everyone quotes.)
What are the odds of a prize large enough to matter to your finances — often several tiers down?
What are the odds of “winning” something that’s worth less than what you paid, which isn’t really winning at all?
A marketing claim like “1 in 24.87 chance to win a prize” is true and almost meaningless, because roughly 3 in 4 of those “prizes” simply return a fraction of your stake.
Chapter 7: Expected Value — What Every Dollar Actually Returns
Expected value (EV) is the average amount you’d get back per dollar wagered if you could play a game an enormous number of times. It’s computed by multiplying each possible outcome’s payout by its probability and summing across every outcome:
⇒ EV = sum over i of P(outcome_i) × payout_i
For a typical lottery game with a jackpot at its advertised starting level, the EV per dollar wagered usually lands somewhere between $0.45 and $0.55 — meaning, on average, you get back less than half your money, spread across every prize tier including the jackpot.
That’s a materially worse return-to-player than most casino games (roulette is typically around $0.95, slot machines commonly $0.85–$0.95, blackjack played well can exceed $0.99), which is one honest way to describe why lotteries are often called “the worst bet in the casino that isn’t in a casino.”
The one place EV genuinely moves: jackpot size. Because the jackpot is the single largest term in that sum, and because a jackpot’s advertised size grows every time it rolls over, EV per dollar rises as the jackpot grows — and in rare cases, for a large-enough rolled-over jackpot with a low-enough combination count, the raw EV of a lottery ticket can technically exceed $1.00. This has happened publicly a handful of times (most famously repeated Massachusetts “Cash WinFall” plays exploited by MIT and Michigan groups in the 2000s and early 2010s, when a small-state game’s jackpot cap created a mathematically favorable “roll-down” event).
This does not mean such a ticket is a good bet in practice, for three reasons covered in the next two chapters: taxes reduce your effective payout well below the advertised jackpot; jackpot-tier prizes are pari-mutuel, so a large, well-publicized rolled-over jackpot attracts more players and a higher chance you’ll have to split it; and the extreme skew of a one-in-hundreds-of-millions payout means the median outcome of playing — what actually happens to you, as opposed to the mathematical average over an impossible number of repetitions — is still a loss, virtually always.
Chapter 8: Independence and Why the Past Tells You Nothing
Each lottery drawing is an independent event: the probability of any given outcome is unaffected by what happened in prior drawings. The balls, or the random number generator, have no memory. This is the single most important, and most consistently misunderstood, fact in the entire book.
The classic illustration is the gambler’s fallacy: the mistaken belief that if a fair coin has come up heads five times in a row, tails is now “due.” It isn’t. The coin has no memory of its last five flips; the sixth flip is still a fresh 50/50 event. The same logic applies, unaltered, to lottery balls. A number that hasn’t been drawn in 40 games is not “due” — its probability of appearing in the 41st game is exactly what it always was, no more and no less.
This directly undercuts a large share of the number-analysis systems in Part III, which are built around the idea of “cold” numbers becoming likelier and “hot” numbers staying likelier. Both intuitions are wrong in the same way, just pointed in opposite directions. What genuine statistics can tell you about past draws is covered honestly in Chapter 12 — mostly, that observed frequency differences among numbers over any real-world sample size are almost always explainable as ordinary random variation, not as a signal about the future.
Chapter 9: Prize Splitting/Sharing — The Hidden Variable
Here is the one place where your choice of numbers genuinely, mathematically matters, and it has nothing to do with your odds of matching the winning numbers.
In a pari-mutuel prize tier, if two ticket holders match the same numbers, they split that tier’s prize pool. Your probability of winning the jackpot is identical for every combination — 1 in 292.2 million for Powerball, no matter which numbers you pick. Your expected payout conditional on winning is not identical, because different combinations are wildly unevenly popular among the buying public.
Popular combinations include:
Birthdates and anniversaries — which cluster overwhelmingly in the 1–31 range, meaning numbers above 31 are systematically underplayed by “meaningful date” bettors
Visually or numerically “neat” patterns — 1-2-3-4-5-6, evenly spaced sequences, diagonal patterns on a play slip
Numbers recently featured in the news, previous jackpot combinations, or numbers suggested by pop culture (a famous case: the numbers from the television show Lost, 4-8-15-16-23-42, are consistently among the most-played combinations in games where that range fits)
If you match the jackpot with an unpopular combination, you are less likely to have to share it, and your expected payout conditional on winning is measurably higher — sometimes dramatically higher — than if you’d matched with 1-6-12-18-24-31 or a date-heavy combination like 3-7-12-19-24-31. This doesn’t change whether you win. It changes how much you keep if you do. Chapter 17 covers concretely how to apply this.
Part III: Systems
Chapter 10: Wheeling
A lottery wheel is a predetermined pattern that arranges a group of chosen numbers into a set of tickets (bets). Wheels are also called covers, block designs, or covering codes in the mathematical literature — wheeling systems are, in fact, a real and long-studied branch of combinatorial design theory, used well outside lotteries in areas like experimental design and error-correcting codes.
Full wheels
A full wheel plays every possible combination of k numbers drawn from your chosen pool of n numbers. If you choose 10 numbers for a 6-number game, a full wheel is C(10,6) = 210 tickets, guaranteeing that if all 6 winning numbers are among your 10, you hold the jackpot ticket, and you also hold every possible lower-tier combination among your 10 numbers.
The appeal is obvious: total coverage of your chosen pool. The problem is equally obvious: cost scales combinatorially, not linearly. Going from 10 to 15 chosen numbers doesn’t multiply your ticket count by 1.5; it multiplies it by roughly 24, because C(15,6) = 5,005.
Numbers chosen Full wheel size (6-number game)
8 28
10 210
12 924
15 5,005
20 38,760
30 593,775
A full wheel is best understood not as a “system” for beating the odds — it changes nothing about your odds per dollar spent — but as a mechanical way to guarantee that, if your intuition about which 10 or 12 or 15 numbers to focus on turns out to be right, you don’t miss the jackpot by having picked the wrong ticket among the combinations those numbers allow. It’s a tool for converting a smaller-scale prediction into total coverage of its consequences, at a cost.
Abbreviated wheels
An abbreviated wheel plays a carefully chosen subset of the full wheel’s combinations, engineered mathematically to guarantee a minimum prize — say, “if 4 of your 6 winning numbers are among your chosen 12, at least one of your tickets is guaranteed to match at least 4” — using far fewer tickets than the full wheel would need.
This is where genuine, nontrivial mathematics enters the picture. Constructing an abbreviated wheel that provides a stated guarantee with the minimum possible number of tickets is a real combinatorial design problem, and well-designed one — the kind published in peer-reviewed combinatorics journals or built into serious wheeling software — will deliver exactly the guarantee it claims. A poorly constructed one (and a great many circulating online are poorly constructed, or claim guarantees they don’t actually deliver) will not.
The trade-off is symmetric with the full wheel’s: abbreviated wheels are cheap, but they only guarantee their stated minimum tier. You can still win more — even the jackpot — but it isn’t guaranteed the way it is with a full wheel.
What a wheel guarantee actually means (and doesn’t)
This is the single most misunderstood claim in the wheeling world, so it’s worth stating with precision. A wheel’s guarantee is entirely conditional: “if N of your chosen numbers are among the drawn numbers, then at least one ticket matches at least M of them.” It says nothing about the probability that N of your chosen numbers will be among the drawn numbers in the first place — that part is exactly as unlikely as it would be for any other set of numbers you might have picked, full stop. A wheel does not increase the chance that your numbers come up. It only guarantees good distribution of the win, across your tickets, if they do.
A minimal example: the 3-if-6-in-12 wheel
T
he smallest genuinely nontrivial abbreviated wheel is also the easiest to prove correct by hand, and it’s worth working through once because the logic behind it — the pigeonhole principle — is the same logic underlying every larger wheel in this book, including the full-coverage partition in Chapter 15.
Take two lines of 6 numbers each, chosen so the two lines share no numbers — 12 distinct numbers across your two tickets. Wheeling notation calls the resulting guarantee “3-if-6-in-12”: if all 6 winning numbers land within your chosen 12, then at least one of your two tickets is guaranteed to match at least 3 of them.
The proof takes one line: if 6 winning numbers are distributed across only two disjoint bins of 6 slots each, there is no way to split 6 items between 2 bins without at least one bin receiving at least ceil(6/2) = 3. The two lines might split the winners 3-3, 4-2, 5-1, or 6-0 — every one of those distributions puts at least 3 winning numbers on at least one ticket. This makes it the cheapest possible wheel carrying that specific guarantee: just two tickets, and the guarantee is airtight by simple counting, not by any statistical claim about the draw.
It also makes plain, in miniature, exactly what a guarantee does and doesn’t buy you. The two tickets are not more likely to contain all 6 winning numbers than any other two tickets you might have bought — that part is unaffected. What the disjoint construction guarantees is only the distribution of a win across your tickets, conditional on your 12 chosen numbers already being lucky enough to contain all 6 winners. The 8-line partition of a 6/48 pool in Chapter 15 is, structurally, four of these 3-if-6-in-12 pairs stacked side by side across the full number range — the same pigeonhole logic, just repeated across a larger pool.
Chapter 11: Key Numbers
A key number (also called a “lock” or “designated number”) is a number the player is confident will appear, forced to appear in every combination of a wheel. This reduces a wheel’s size substantially, since one of the k slots is fixed rather than chosen from the pool.
The mathematics is simple: locking one number in a 6-from-12 wheel reduces it to choosing 5 from the remaining 11, cutting the combination count roughly in half or better. The catch is symmetric and unforgiving: if your key number is wrong, every single ticket in that wheel is disqualified from the jackpot, no matter how good the other five numbers were. There is no mathematical method — none — that improves the odds that a given specific number will be drawn above its baseline k/n probability. Key numbers are a bet-sizing tool, not a prediction tool.
Chapter 12: Frequency Analysis — Hot and Cold Numbers
This is the most popular non-wheeling system in circulation, and the one where good statistics and bad statistics look the most alike.
What’s real: if you flip a fair coin 10,000 times, you will observe some numbers of heads-in-a-row streaks, and some 100-flip windows with more heads than tails, purely from ordinary variance. The same is true of lottery numbers. Over any finite sample of real draws, some numbers will have appeared more often than others, purely by chance — this is not a flaw in the analysis, it’s a mathematical certainty of any random process observed a finite number of times.
What’s not real: the inference that a number’s past frequency predicts its future frequency. Chapter 8 already covered why — independence — but it’s worth restating in frequency terms specifically: over a long-enough run, every number’s frequency will converge toward the same expected value (roughly 6/49 of draws, for a 6/49 game, for any single number), precisely because each draw is independent and unaffected by the others, not despite it. “Regression to the mean” is real; “a cold number becoming more likely because it’s cold” is a different, false claim that borrows the same vocabulary.
A useful reframe: hot/cold analysis of your own play history is worthless as prediction, but hot/cold analysis of the broader player population’s number choices (birthdates cluster low, “lucky” numbers cluster around certain digits) is genuinely useful — not for prediction, but for the prize-splitting strategy in Chapter 9 and Chapter 17.
Chapter 13: Filters
Filters accept or reject candidate combinations based on some statistical property, typically used to shrink a wheel’s ticket count by discarding combinations judged “unlikely.” Common filter types:
Sum range — the total of all 6 numbers in a typical 6/49 draw clusters, by the central limit theorem, around a bell curve centered near 150 (the mean of all possible 6-number sums), so filters often discard combinations with an unusually low or high sum, like 1-2-3-4-5-6 (sum 21) or 44-45-46-47-48-49 (sum 279).
Odd/even balance — most real draws land close to a 3-odd/3-even split, so filters discard heavily lopsided combinations (like all-even or all-odd).
High/low balance — similarly, most draws split roughly evenly between the lower and upper half of the number range.
Consecutive-number limits — draws with three or more consecutive numbers are statistically less common than draws with none, so some filters cap how many consecutive numbers a combination may contain.
The honest framing: these filters describe real, well-documented statistical properties of the outcome space itself — it is true that a 6/49 draw is more likely to land near a sum of 150 than near a sum of 21, for exactly the same reason a sum of 7 is the most common outcome of rolling two dice: there are simply more combinations that produce a middling sum than an extreme one. This is legitimate combinatorics, not superstition.
The trap: applying that population-level fact to reject a specific combination for a specific future draw is a different move, and an invalid one. 1-2-3-4-5-6 is exactly as likely to be drawn as any sum-150 combination, individually. What’s true is that the set of all sum-150-ish combinations is much larger than the set of extreme-sum combinations — so if you must reduce a huge wheel down to a smaller, affordable set of tickets, biasing that reduction toward the statistically denser region of the outcome space is a defensible way to spend a limited budget, purely because you’re playing more of the combinations that make up most of the space. It does not raise the probability that any one of your tickets wins.
Chapter 14: Delta Systems, Decade Reduction, and Positional Play
Several more specialized filtering techniques deserve a brief, honest treatment:
Delta (difference) systems analyze the gaps between consecutively-sorted numbers in a drawn combination (e.g., for 5-15-27-34-38-44, the deltas are 10, 12, 7, 4, 6) rather than the numbers themselves, on the theory that gap patterns are more stable than raw numbers. This is a legitimate transformation used in real combinatorics and cryptography, and delta-based filters can meaningfully shrink a wheel’s size the same way sum filters do — but it carries exactly the same limitation as every filter in Chapter 13: it changes which slice of the outcome space you’re covering, not the probability that your slice contains the winner.
Decade reduction splits the number range into blocks of ten (1–10, 11–20, etc.) and looks at how draws distribute across those blocks, similar in spirit to the high/low split but with finer granularity. Same honest framing applies.
Positional play looks at whether, historically, the nth-smallest number in a draw tends to fall within a certain range (e.g., the smallest of six numbers is disproportionately under 15). This is genuinely true as an artifact of order statistics — if you draw 6 numbers from 49 without replacement, the expected value of the smallest one actually is mathematically lower than 49/2, simply because it’s defined as the minimum of six draws — but, again, it describes the population of possible draws, not a predictive edge on the next one.
Chapter 15: Full-Coverage Play — Playing All the Numbers in Well-Constructed Combinations
This chapter works through the concept at the center of this book’s own approach to number selection: playing the entire number pool, split across a small number of tickets, so that every possible winning number is present on at least one of your lines.
The construction
Take a 6/48 game (chosen here purely for a clean division: 48 ÷ 6 = 8). Partition all 48 numbers into 8 disjoint lines of 6 numbers each, with no number repeated across lines — a full, non-overlapping partition of the number pool. Every one of the 48 numbers you might need appears on exactly one of your 8 tickets.
What this guarantees: at most 6 of your 8 tickets can contain any of the 6 winning numbers, since 6 winning numbers, spread across 8 disjoint 6-number lines, can touch at most 6 lines. In practice, because the winning numbers are themselves spread somewhat randomly across your partition, they typically land across anywhere from 3 to 6 of your 8 lines — rarely fewer, since the numbers are unlikely to cluster onto very few of your lines by chance.
What this does not do: it does not change the number of equally likely outcomes for a 6/48 draw, which remains C(48,6) = 12,271,512 regardless of how you group your tickets. Buying 8 tickets that partition the full number range gives you 8 chances out of that 12,271,512 — the same 8 chances, dollar for dollar, that any other 8 tickets would give you, disjoint or not. There is a natural and very understandable intuition that says: “if only 6 or fewer of my lines can contain the winning numbers, doesn’t that effectively shrink my odds down to something like a 6-from-36 game?” It’s worth working through carefully, because the intuition is subtle and the correction is genuinely interesting rather than dismissive.
The 36 numbers that “could have” held the winners are only identifiable after the draw — they’re whichever 6 of your 8 lines happen to contain a winning number, and which 6 lines those are changes every single time. Before the draw, all 48 of your numbers are equally live, because you don’t yet know which lines will turn out to matter. Odds are always computed on what’s committed to in advance, not on what a draw happens to reveal afterward. To see this precisely:
⇒ 8 tickets in a 6/48 game = 8/12,271,512 ≈ 1 chance in 1,533,939
⇒ A single ticket in a 6/36 game = 1/1,947,792 ≈ 1 chance in 1,947,792
Your 8-ticket, full-coverage play is meaningfully better than a single 6/36 ticket — roughly 27% better, in fact — but that’s simply the mathematically unremarkable fact that 8 tickets beat 1 ticket. It cost you 8 tickets to get there. Divide by cost, and the improvement vanishes entirely: 8 tickets at 1-in-1,533,939 is functionally identical, dollar for dollar, to 8 single tickets at 1-in-12,271,512 played any other way, disjoint or overlapping, structured or random.
So what does the structure actually buy you?
Not better jackpot odds per dollar — nothing does that. What a disjoint, full-coverage partition does provide is something different and genuinely worth having: it guarantees you never waste a winning number by having it appear on two of your own tickets at once (since no number repeats across lines), which maximizes the number of distinct winning numbers you can possibly match across your whole play. That’s valuable for one specific goal — casting the widest possible net across the lower prize tiers with a fixed, small ticket budget — and it’s a real, well-understood property of combinatorial design, not an illusion.
It comes at a specific, direct cost, though: because no number repeats across your lines, if 4 of the 6 winning numbers happen to land on 4 different tickets of yours, you’ll hold four separate 1-match tickets rather than concentrating multiple matches onto one — which is the opposite of what most abbreviated wheels (Chapter 10) are deliberately engineered to do. Abbreviated wheels intentionally overlap numbers across lines specifically so that when several winning numbers appear, they concentrate onto fewer tickets, each with a higher match count, which is what triggers most lower-tier prizes in the first place. A disjoint partition spreads matches thin instead of concentrating them — good for touching every number in your budget, worse for stacking wins onto a single ticket.
Both are legitimate, well-defined strategies with a genuine trade-off between them; neither is more “correct” than the other, and neither improves your odds of the jackpot beyond what your total ticket count already buys you on its own.
Part IV: What’s Real and What Isn’t
Chapter 16: Things That Feel Like Edges But Aren’t
This chapter is a field guide to the most common false edges in lottery folklore — not because believing them is foolish, but because each one is built on an intuition that is genuinely reasonable in other contexts and simply doesn’t transfer to independent random draws.
“Due” numbers. Covered at length in Chapter 8. A number absent for 50 draws is not more likely to appear on draw 51. Its probability is identical to a number that appeared last week.
“Leaping” or repeat numbers. Some systems track how often a number repeats in back-to-back draws, on the theory that repeats are either unusually common or unusually rare and therefore predictive. In a well-run random draw, the repeat rate converges to exactly what pure chance predicts (k/n for each number, same as any other draw), and any short-term deviation is noise.
Reverse-digit and mirror-number systems. Popular in Pick-3/4 circles: if 137 was drawn, some systems flag 731 (the reverse) or a “mirror” number (each digit plus 5, mod 10) as more likely soon. There’s no mechanism — mathematical or physical — connecting one draw’s digits to another draw’s digits in this way.
Arithmetic relationships among drawn numbers. Retrospective analysis will always find some pattern in a completed draw — numbers that sum to a round figure, numbers in arithmetic progression, numbers that are all multiples of something. With enough completed draws to search through and enough possible patterns to check for, finding a coincidence is statistically guaranteed (this is the same effect statisticians call “multiple comparisons” or “data dredging”), and it says nothing about the next draw.
Lucky charms, psychics, and numerology. No mechanism connects a birthstone, a medallion, or the digit-sum of a birthdate to the outcome of a physically or algorithmically random draw. These carry zero mathematical claim on your numbers and should be understood purely as entertainment, if you enjoy them at all — never as an “edge” worth paying for.
“Balanced” combinations as intrinsically more likely. Chapter 13 already drew this line carefully, but it bears repeating in one sentence: a balanced-looking combination is not more likely than an unbalanced one; there are simply more balanced-looking combinations in total across the whole possibility space.
Chapter 17: Things That Actually Are Edges
Everything in this chapter is compatible with everything said so far. None of it changes your odds of matching the winning numbers. All of it changes your expected payout, your risk profile, or the efficiency of a fixed budget — which are the only three levers that genuinely exist.
Rollover timing
As Chapter 7 established, EV per dollar rises as a jackpot grows, because the jackpot term dominates the expected-value sum. A player who concentrates their fixed annual lottery budget into the handful of draws each year when a jackpot has rolled over several times, and skips the routine, freshly-reset draws entirely, will have a measurably higher average EV per dollar across their play than a player who spreads the same total budget evenly across every draw. This is the single cleanest, best-evidenced “edge” available to an ordinary player, and it costs nothing beyond discipline.
Unpopular-combination selection
Also established, in Chapter 9: choosing combinations that are unpopular among the broader player pool — avoiding pure birthdate ranges (1–31), avoiding widely-shared “lucky” patterns, avoiding numbers currently getting media attention — measurably raises your expected payout conditional on winning a shared, pari-mutuel tier, without changing your probability of winning it. Quick Picks (computer-generated random selections) are, incidentally, a reasonable way to approximate this, since they’re drawn uniformly across the whole range rather than clustering the way human-chosen numbers do.
Syndicate leverage
A syndicate (lottery pool or club) pools money from many players to buy more tickets — sometimes hundreds or thousands — than any individual could afford alone, then splits any winnings proportionally. This doesn’t change the odds per ticket, but it changes what an individual member can afford to have exposure to. A ticket bought via a well-run syndicate is exactly as good a bet as a ticket bought alone; the leverage is in aggregating capital, not in beating the math. Chapter 22 covers the practical and legal mechanics.
Tax and payout structuring
How and when you take a large prize — lump sum versus annuity, which jurisdiction you claim in if you have a choice, how you structure gifts and trusts around it — has a large, real, and entirely legal effect on how much of a jackpot you actually keep. This is covered in Chapter 25.
Chapter 18: The Strongest Move Nobody Sells You — Playing Less
No one profits from telling you this, which is exactly why it’s almost never said out loud in a lottery book: for the overwhelming majority of players, playing less, or not at all, is worth more than most of the prizes they will ever collect.
Here’s the arithmetic. Suppose you spend $10 a week on lottery tickets — a modest, common amount — for a year: $520. Across most lottery games’ overall structures, somewhere between 45 and 60 cents of every dollar wagered is returned to players as prizes, in aggregate, across every tier. That means the expected value of a year of $10-a-week play, spread across every possible outcome including the astronomically unlikely jackpot, is roughly $235 to $310 — meaning the expected loss is roughly $210 to $285 per year.
Simply not playing that $520 converts that expected loss into a guaranteed $520 in your pocket. Compare that to what most players actually experience: the median outcome of a year of $10-a-week play is not “roughly $270 back” — it’s near-total loss, because virtually all of that expected return is concentrated in a jackpot-sized tail event that, for any single player, essentially never happens. The overwhelming majority of players who play consistently for a full year win small prizes intermittently and lose the great bulk of what they spent. The guaranteed $520 saved by not playing is, for most people, larger than their entire lifetime lottery winnings.
Playing half as often captures exactly half of this guaranteed value while retaining half your jackpot exposure — a genuinely useful middle position for someone who enjoys playing but wants to be honest with themselves about the arithmetic. There is no dishonor and no missed opportunity in choosing this. It is, quite literally, the largest positive-expected-value decision most players will ever make regarding the lottery, and it’s the one system in this entire book that is mathematically guaranteed to work exactly as described, every single time.
Chapter 19: Trading Chances Across Draws
Building on rollover timing (Chapter 17), this chapter treats your total lottery budget as something to be actively allocated, not evenly spent.
The total expected return per dollar wagered is fixed by a game’s payout table — you cannot change that number for a single draw. But its distribution across draws is entirely up to you. A player with a fixed annual budget of, say, $200 has at least three ways to deploy it:
Even spread — $200 spread evenly across all 52 weekly draws (~$3.85/week), regardless of jackpot size.
Rollover concentration — skip freshly-reset, low-jackpot draws entirely; concentrate the full $200 into the 8–12 draws a year when the jackpot has rolled over multiple times and crossed a chosen threshold.
Barbell — spend a small, fixed amount every week to “stay in the game” emotionally and for smaller regular games, while reserving a larger reserve specifically for major rollover events in the big multi-state games.
Strategy 2 has the highest expected value per dollar of the three, for the reasons given in Chapter 7 and 17. It explicitly trades away the (already vanishingly small) chance of winning during an ordinary, freshly-reset draw in exchange for concentrating your exposure into draws where the underlying arithmetic is measurably better — the same total dollars, deliberately relocated to more favorable moments, at the cost of worse effective odds during all the draws you skip.
Chapter 20: Variance Shaping
The last genuine lever available to a player is not raising expected value at all, but choosing the shape of your risk — trading the chance of a modest, more probable win against the chance of a life-changing, wildly improbable one, without necessarily changing your total expected loss.
Many small-tier tickets (e.g., an abbreviated wheel guaranteeing a specific lower-tier match, Chapter 10) shifts your outcome distribution toward more frequent, smaller wins and away from jackpot exposure, for players who value the more tangible, more probable payoff, or who are using tickets as a wheel-guaranteed hedge within a fixed number pool.
Concentrated jackpot-only play (fewer tickets, no wheeling, played specifically during high-rollover draws per Chapter 19) shifts the distribution the other way: almost certain loss, but with the largest possible payoff on the rare occasion of a win.
Full-coverage play (Chapter 15) sits in between: it maximizes the breadth of numbers you’re exposed to for a fixed small ticket count, spreading potential lower-tier matches across your play without materially changing jackpot odds.
None of these choices is more “correct” than another in expected-value terms — they largely wash out to the same underlying arithmetic — but they are meaningfully different in what kind of outcome you’re likely to actually experience, which is a legitimate thing to optimize for if you’re honest that you’re doing it.
Part V: Practice
Chapter 21: Lottery Software — What It Does, What It Can’t, and How to Evaluate a Vendor
The market for lottery software is large, largely unregulated, and includes everything from genuinely useful record-keeping and wheel-construction tools to outright fraud. Here is what the honest categories of software actually do.
What legitimate lottery software does
Wheel generation — mathematically constructs full or abbreviated wheels for a chosen number pool and guarantee level, and verifies (or should verify) that the guarantee is actually met. This is a real, checkable computational task.
Historical draw databases and frequency tracking — compiles and displays past draw results, hot/cold counts, skip-and-hit charts, sum and parity statistics. This is honest reporting of real historical data; the software isn’t lying to you about the past, only (in some cases) implying more about the future than the data supports.
Filter construction — lets you apply the sum-range, odd/even, high/low, and delta filters covered in Chapters 13–14 to shrink a wheel down to an affordable ticket count.
Ticket-slip printing and organization — a purely administrative convenience, useful for anyone playing a wheel with more than a handful of lines.
What no legitimate software does
Predict a specific future drawing with better-than-baseline accuracy.
“Beat” a properly-run random or mechanically audited draw.
Turn a negative-expected-value game into a positive-expected-value one for a normal jackpot level (the rare, real exceptions in Chapter 7 required specific structural quirks unrelated to any software’s number-picking cleverness).
Red flags when evaluating a vendor
Guaranteed-win language, or claims of a specific hit rate on jackpots. No legitimate wheel or filter changes jackpot odds; any claim that one does is false, full stop.
Testimonials as the primary evidence, with no way to independently audit the claimed track record. Ask what specific, checkable draws the software predicted in advance, not after the fact.
Pressure to buy quickly, “limited time” pricing, or upsells for “complete” functionality after purchase. Legitimate software vendors disclose their full feature set and pricing upfront.
No free trial or demo mode for wheel/filter construction, when the underlying mathematics (as covered in this book) is entirely something you could verify yourself with a spreadsheet.
Vague “chaos theory,” “quantum,” or similarly dressed-up scientific language used to explain why the software supposedly works, without a specific, checkable mechanism.
A useful test before paying for anything: ask the vendor directly, in writing, for the mathematical or statistical basis of any predictive claim and independently verify it — or ask someone who can — against the material in Part II of this book. A vendor unwilling or unable to explain the mechanism in falsifiable terms is not selling you mathematics.
Software for full-coverage and wheel construction, generally
Independent of any specific commercial vendor, the wheel-construction task described in Chapters 10 and 15 is a solved combinatorial problem, and several academic and open-source resources publish verified, guarantee-checked wheel designs for free — see the Resources chapter. Building a simple full or disjoint-partition wheel, as in Chapter 15, requires nothing more sophisticated than a spreadsheet.
Chapter 22: Syndicates
A lottery syndicate (pool, club, or group) is simply a group of people who contribute money to buy tickets collectively and agree in advance to split any winnings. The appeal, per Chapter 17, is genuine: it lets a group afford far more tickets, and therefore far more combinations, than any individual member could alone, at proportionally shared cost and proportionally shared payout.
Syndicates fail — and end up in court, which they do with some regularity — for entirely predictable, avoidable reasons:
No written agreement. Verbal “we’ll split it if we win” arrangements among coworkers or friends are the single most common source of lottery-syndicate lawsuits. A short-written agreement, signed by every member before the draw, specifying exact contribution amounts, exact split percentages, and who is authorized to purchase and claim tickets, resolves the overwhelming majority of potential disputes before they start.
Ambiguity about which specific tickets are “syndicate” tickets. A member who buys an extra personal ticket alongside the group’s tickets, without clearly separating them, creates exactly the kind of confusion that ends up disputed.
No designated point of contact for claiming a prize, especially for larger, multi-state games with specific claim deadlines and (depending on jurisdiction) public-disclosure requirements that a single designated claimant needs to navigate on behalf of the group.
New or departing members whose status wasn’t clarified before a draw.
A workable syndicate agreement is short — a single page listing member, contribution amounts, split shares, the specific game(s) and ticket-purchase method covered, and a named claimant — and it should be signed before, not after, a draw.
Chapter 23: Bankroll and Budget Discipline
The single most important practical rule in this book, restated in budgeting terms: decide your lottery spending in advance, as a fixed entertainment-category amount you could lose entirely without affecting anything that matters, and never exceed it regardless of jackpot size, a recent near-miss, or a recent small win.
A workable framework:
Set a fixed period budget (weekly or monthly), sized the same way you’d size any other discretionary entertainment spending — a movie ticket, a dinner out — never money earmarked for bills, debt, or savings.
Never reinvest winnings. A common and costly habit is plowing a small prize straight back into more tickets rather than banking it; Chapter 18’s math on the value of not playing applies with equal force to winnings as to new money.
Track total spend, not just individual purchases. It’s easy to lose sight of a cumulative $15-a-week habit; a simple running log makes the real annual number visible.
Decide your rollover-concentration threshold (Chapter 19) in advance, in writing, rather than deciding in the moment when a jackpot headline is already in front of you — headline-driven decisions are consistently worse-calibrated than pre-committed rules.
Chapter 24: Martingales and Chase Systems
A martingale is a betting progression in which you double your stake after every loss, on the theory that a single eventual win recovers all prior losses plus one unit of profit. It’s the classic strategy for an even-money game — red/black roulette, for instance, at roughly 1-in-2.06 odds per spin including the zero. There, doubling has a clean logic: whenever the win finally comes, it pays exactly enough, at that doubled stake, to erase every prior loss in the sequence and net one original unit of profit.
Worked example (even-money game). Starting at $2 and doubling after each loss: $2, $4, $8, $16, $32, $64, $128, $256, $512 — by the ninth consecutive loss, you’ve wagered $1,022 cumulatively, and the required next stake is $1,024, just to net a $2 profit once you finally win. The strategy fails because the stake grows exponentially while any real bankroll and betting limit are finite. A losing streak long enough to force a stake beyond what you can afford, or beyond the table limit, is not a rare fluke on a near-even-money game — it happens to sustained martingale players repeatedly, and when it does, the strategy locks in the entire accumulated loss with no way to recover it.
Why this doesn’t map onto Pick 3 the way it’s often sold. A straight Pick-3 bet doesn’t pay even money — it pays roughly 500-to-1 (a $2 straight bet returns about $1,000 on a win, against 1-in-1,000 odds). That payout ratio breaks the doubling logic entirely: a single flat $2 bet, if it hits, already returns far more than enough to cover a very long losing streak’s cumulative cost. There’s no mathematical reason to double the stake after a loss on a bet like this, and doing so only escalates risk for no corresponding benefit.
That doesn’t make flat-betting Pick 3 “chase-proof,” though — it fails for a different, more basic reason. With 1-in-1,000 odds per play, the probability of never hitting across 250 consecutive $2 plays is (999/1000)^250 ≈ 78%. Put another way: a player flat-betting $2 a day for 250 days has roughly a 4-in-5 chance of never winning at all across that entire run, losing the full $500 wagered, regardless of bet size or progression. Across the full 250 plays, the expected loss is a steady $250 — exactly what Chapter 7’s return-to-player math predicts (roughly 50 cents back per dollar wagered) — and no pattern of escalating, flat, or “chasing” stakes changes that expected figure, because each play remains an independent event unaffected by the ones before it.
The mathematics of independent events (Chapter 8) is precisely why martingales, and chase systems generally, fail on any unfavorable game regardless of its specific payout structure: no sequence of past losses changes the odds of the next play, so there is no point in a losing streak at which a win becomes “due” to bail you out, and no adjustment to bet size changes the underlying expected value of the game. Avoid any system, in this book or sold elsewhere, that recommends increasing your stake specifically because of a recent loss.
Chapter 25: If You Win
The first hours
Sign the back of a physical ticket immediately, store it somewhere secure (a safe deposit box, not a wallet), and make several copies or photographs before doing anything else. Do not announce a win publicly, on social media, or to anyone beyond your immediate household, until you have taken the steps below — word travels fast, and unsolicited financial and personal requests from distant acquaintances are one of the most consistently reported burdens of large winners.
Anonymity by jurisdiction
Whether you can remain anonymous varies sharply and is entirely outside your control once you’ve decided which jurisdiction to claim in (if you had a choice at purchase). Some U.S. states permit anonymous claims or claims through a trust; others require full public disclosure of the winner’s name, hometown, and photograph as a condition of payment, specifically to demonstrate to the public that winners are real and that the game is fair. Confirm your specific state or country’s rule before doing anything else — this is not a detail to guess at.
Lump sum versus annuity
Multi-state jackpots are typically advertised at their annuity value (paid over roughly 30 years) but can usually be taken as a smaller lump sum instead (commonly 50–65% of the advertised annuity figure, reflecting the time value of money). The right choice depends on your tax situation, investment discipline, life expectancy, and estate planning goals — this is a genuine financial-planning decision, not a mathematical one with a single right answer, and it is exactly the kind of decision to make with a qualified, fee-only fiduciary advisor rather than alone or based on a lottery book’s opinion.
Taxes
In the U.S., the IRS withholds 24% automatically from prizes over $5,000, but large jackpots typically push a winner into the top federal bracket, meaning additional tax is owed beyond the withholding — a detail that catches unprepared winners off guard. State tax treatment varies enormously, from no additional tax in several states to significant additional withholding in others. Non-U.S. jurisdictions vary even more widely; Canadian and UK lottery winnings, for instance, are generally not taxed as income at all.
Advisers
Before making any major decision — quitting a job, buying property, gifting large sums, telling extended family — assemble a small team: a fee-only financial advisor (not a commission-based salesperson eager to place your winnings into products that pay them), an estate attorney, and a CPA experienced with sudden-wealth situations.
Several documented cases of lottery winners who lost most or all of a large jackpot within a few years share a common thread: rapid, unadvised spending and lending decisions made in the first months, before a professional team was in place. Waiting even a few weeks to claim (most jurisdictions allow a claim window of 90 days to a year) to assemble that team costs nothing and has repeatedly proven worthwhile in the recorded aftermath of major jackpot wins.
Glossary of Lottery Terms
Abbreviated wheel — A wheeling system using fewer than all possible combinations of a chosen number pool, engineered to guarantee a specific minimum prize under stated conditions rather than guaranteeing the jackpot.
Agent (retailer) — A business licensed to sell lottery tickets on behalf of the operator.
Annuity — A prize payment option spreading a jackpot across many years (commonly 29–30) rather than paying it as a single lump sum.
Bonus ball — An additional number drawn beyond the main set, used in some games to create extra prize tiers.
Box (boxed bet) — In Pick 3/4 games, a wager that pays if the chosen digits are drawn in any order, as opposed to the exact order required by a straight bet.
Cold number — A number drawn less often than average over some observed period. See Chapter 12 for why this carries no predictive value.
Combination — An unordered selection of items from a larger pool; the mathematical basis for computing lottery odds via C(n,k).
Combo bet — In Pick 3/4 games, a wager covering every straight-order permutation of a chosen set of digits.
Covering design — The formal mathematical term for a wheeling system; a set of combinations guaranteed to satisfy a stated intersection property with any sufficiently overlapping winning set.
Decade — A block of ten consecutive numbers (1–10, 11–20, etc.) used in decade-reduction filtering.
Delta system — A number-selection method based on the gaps between sorted numbers in a combination, rather than the numbers themselves.
Draw — A single instance of a lottery’s number-selection event, whether by mechanical ball machine or random number generator.
EuroMillions / EuroJackpot — Multinational European lottery games sharing a prize pool and draw across several partner countries.
Expected value (EV) — The probability-weighted average payout of a wager; see Chapter 7.
Filter — A rule used to include or exclude candidate number combinations from a wheel, based on a statistical property such as sum, parity, or number range.
Full wheel — A wheeling system that includes every possible combination of k numbers from a chosen pool of n numbers.
Gambler’s fallacy — The mistaken belief that a random, independent process is more or less likely to produce a given outcome because of recent history. See Chapter 8.
Hot number — A number drawn more often than average over some observed period. See Chapter 12.
Independence (statistical) — The property that one event’s outcome has no effect on the probability of a later event; the defining feature of a properly run lottery draw.
Jackpot — A lottery’s top prize, typically requiring all drawn numbers to be matched, often pari-mutuel and subject to rollover.
Key number (lock) — A number a player chooses to include in every combination of a wheel.
Keno — A game in which the operator draws a fixed number of balls (commonly 20) from a large pool (commonly 80), against which players match a smaller, self-selected set of numbers.
Martingale — A betting progression that increases the stake after each loss; mathematically unsound against any independent-event game. See Chapter 24.
Multiplier (e.g., Power Play, Megaplier) — An add-on feature (sometimes now built into the base ticket price) that multiplies non-jackpot prize tiers by a randomly drawn factor.
Overall odds — The combined probability of winning any prize tier at all, usually dominated by the lowest, smallest-value tier; see Chapter 6.
Pari-mutuel — A prize structure in which a fixed pool of money is divided among however many winners occur at a given tier, as opposed to a fixed dollar prize per winner.
Powerball — Both the specific U.S. multi-state game and, generically, the secondary “extra” ball drawn from a separate pool in that style of game.
Prize tier — A specific matching level (e.g., match 5, match 4 + bonus) with its own associated prize and odds.
Quick Pick — A randomly generated set of numbers selected by the terminal rather than chosen manually by the player.
Rollover — The carrying-forward of an unwon jackpot into the next drawing, increasing its size.
Straight bet — In Pick 3/4 games, a wager requiring the exact drawn order of digits.
Syndicate (lottery pool/club) — A group of players who pool funds to buy tickets collectively and split winnings by prior agreement.
Wheel / wheeling system — A predetermined pattern arranging a chosen set of numbers into multiple tickets to satisfy a stated coverage guarantee.
Reference Tables
Odds by game (approximate, 2026)
Game Format Jackpot odds
Pick 3 (straight) 3 digits, 0–9 1 in 1,000
Pick 4 (straight) 4 digits, 0–9 1 in 10,000
Pick 5 (5/39 style) 5 of 39 1 in 575,757
6/42 lotto 6 of 42 1 in 5,245,786
6/49 lotto 6 of 49 1 in 13,983,816
Mega Millions 5/70 + 1/24 1 in 290,472,336
Powerball 5/69 + 1/26 1 in 292,201,338
Full-wheel sizes (6-number games)
Numbers chosen Full wheel size
8 28
10 210
12 924
15 5,005
20 38,760
30 593,775
Full-wheel sizes (5-number games)
Numbers chosen Full wheel size
10 252
15 3,003
20 15,504
30 142,506
Resources
The lottery-software and lottery-information landscape changes constantly — vendors, forums, and even entire games appear and disappear over a period of years, and any printed list of specific web addresses tends to go stale quickly. Rather than list specific commercial products (see Chapter 21 for how to evaluate any vendor you find on your own), this chapter points to durable categories of resource and how to find current examples in each.
Official lottery operators
Always start here for authoritative odds, prize structures, claim rules, and results — never take odds or rules from a third-party site over the operator’s own published information.
Your own state, provincial, or national lottery’s official website
www.powerball.com and www.megamillions.com for the two major U.S. multi-state games
www.musl.com — the Multi-State Lottery Association, which administers Powerball and other shared games
www.naspl.org — the North American Association of State and Provincial Lotteries, with links to every member lottery
www.world-lotteries.org — the World Lottery Association, for international games
Mathematics and combinatorics
Any current university-level introductory textbook on combinatorics or probability will cover the C(n,k) formula and independence in far more depth than this book has room for.
Search academic literature (Google Scholar or similar) for “covering design” or “lottery wheel” for peer-reviewed treatments of wheel construction — this is real, published mathematics, not lottery-industry marketing.
Player communities and news
Search for active lottery-player forums (LotteryPost.com) and news aggregators; these communities are useful for results, jackpot tracking, and comparing notes with other players, but treat prediction claims made there with the same skepticism urged in Chapter 21.
Problem gambling support
National Problem Gambling Helpline (U.S.): 1-800-MY-RESET (1-800-697-3738), 24/7, free, confidential. The prior number, 1-800-522-4700, also still connects.
Search for your own country’s or region’s problem-gambling support service if outside the U.S.; most national or regional gambling regulators publish one prominently.
A note on this book’s own sourcing
This book was written in 2026 to explain the mathematics of lottery play honestly rather than to sell a system. Every odds figure and game-format detail was checked against current official sources at the time of writing; because lottery operators periodically change matrices, prices, and prize structures (as Mega Millions did in 2025), always verify current details with your own lottery operator before relying on any specific number in this book.
A Final Word
If you take away one thing from this book, let it be this: nothing here, and nothing sold to you anywhere else, changes the probability of any single lottery drawing. What genuinely is in your control is how much you spend, when you spend it, which numbers you pick among equally likely alternatives, and what you do if you win. Handled honestly, those four things are worth far more to you than any system claiming to do what none of them can.
Play for the entertainment, budget it like any other entertainment expense, and let the arithmetic in this book — not a headline, not a hunch, and not a piece of software’s marketing copy — be what guides you.
Good luck, and good playing.
— Robert Perkis
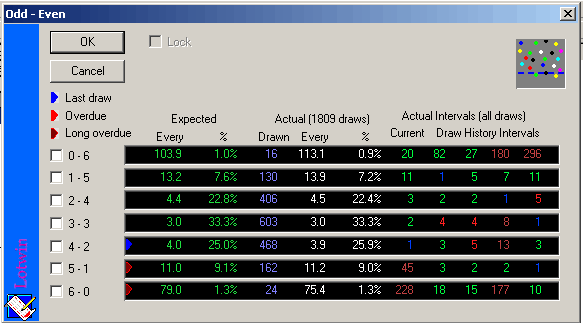
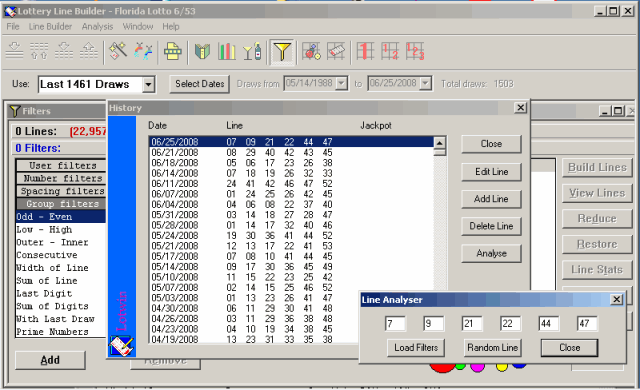
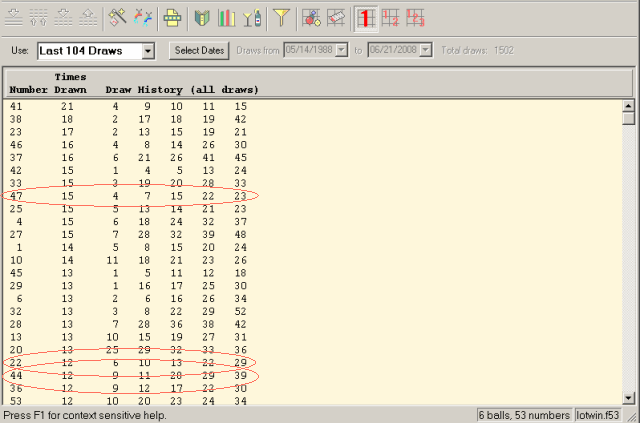
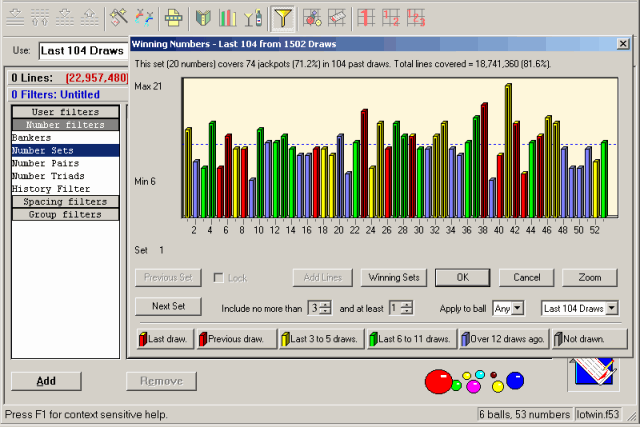
 Bonus: How To Win Your Lottery Using Lotwinby Robert Perkis / Lotto-LogixLotwin Lottery Line Builder is an extremely interesting While most filtering software remove filter offending Not only can Lotwin make filtered wheels, it can treat Lotwin can also scan a user selected range of past draws Seriously, you can look back say 100 draws and find the What else we’ve got, is really pretty incredible. Up front I’ve got to be honest with you. This isn’t a No, I’m not here to talk about the value of features Like most lottery software, Lotwin has a history file Each draw can be high-lighted and among the add, edit, Ok, the filters that produced the winning combination This is absolute proof the game can be filtered down Let’s look at some typical filters Take Odd/Even or Low/High for Pick-6/49 there are 0/6 = 134,596 combinations As you can see, our choice makes a big difference in Lotwin helps us make our decision by telling us which
Clearly 3/3 is one third of the combinations, will be Say the last draw was 5/1 these occur roughly 10% of Not that selecting the biggest filter setting for each Every draw has a wild card factor, at least one filter On the other hand, what if there were 10 filters and The trick to this method, is to select the one filter After all, the game is random. It is very difficult to We know playing all the numbers at the start makes a lot Think about this. Using the Money Matters method to “win” Walk Through the Process with me. Here we have a screen shot with the history file open.
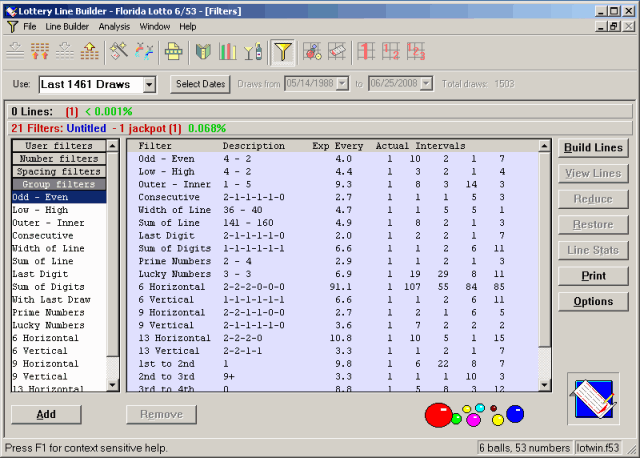
In this screen shot the winning filters have been sent I call your attention to the upper left side of the 0 Lines: (1) <0.001%
21 Filters: Untitled - 1 jackpot (1) 0.068%
The software knows what we are doing, telling us one
line will be revealed when [Build Lines] is clicked.
Also that 1 unique jackpot combination of these numbers
has been found in the draw history file.
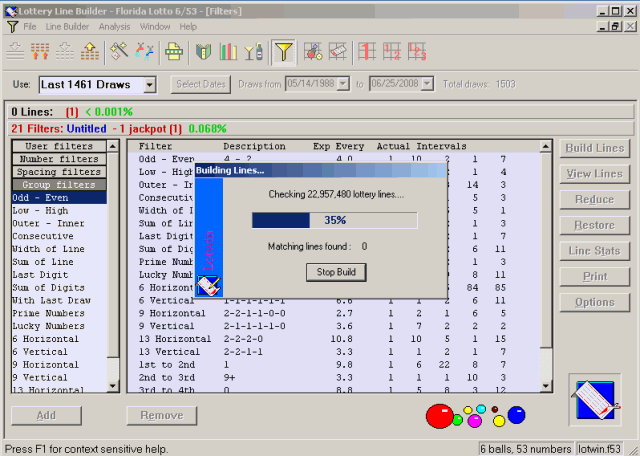
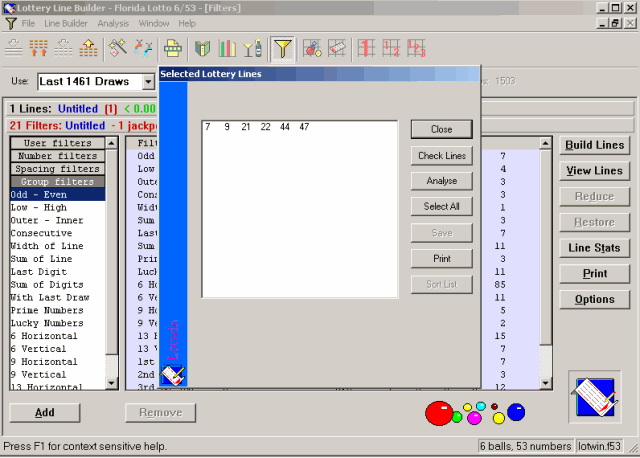
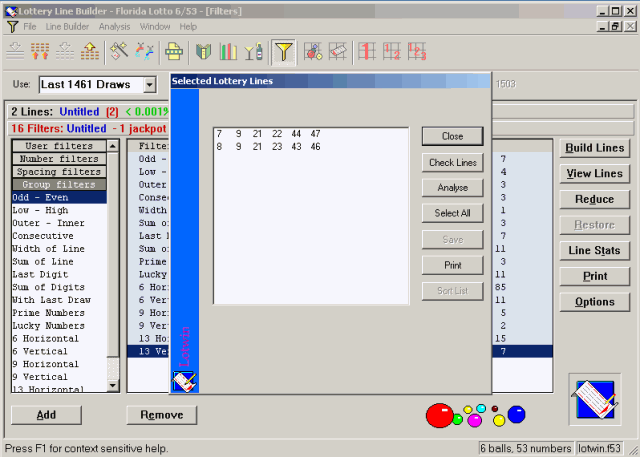
In the third screen shot, [Build Lines] has been clicked.
Here in the forth screen shot [View Lines] has been clicked
In the final screen shot, I’ve used the high-light and the Just so you know, if I drop the next 4 filters, taking us When we drop Lucky Numbers the 11th Filter, we jump to 197 Of course this is all hindsight, boot strapping so to speak. Not that I always use the strategy of skipping the final Note of Information: See the 11th Filter, “Lucky Numbers.”
The next screen shot shows the Lotwin – Winning Numbers Note: In this case we’re working with the last 104 draws drawn Recall in “Why We Lose” we talked about every drawn combination It doesn’t matter where in the screen shot below we draw our line Just below the Hot numbers the “22” and “44” appear as Average If we were to draw our line between Average and Cold at 10 and 9 Cold does NOT mean Dead. Cold numbers are drawn, just not as Clearly any system that leads us to playing all Hot or all Cold
In the following screen shot we see what our first filter should be. The Number Sets filter displays all 53 numbers in a frequency graph. When a number’s color bar is clicked on, a black bar is shown in its In the screen shot I’ve selected all the Hot numbers from 41 to 20 At the top it says, “This set (20 numbers) covers 74 jackpots (71.2%) What we really need to do is make sure our Hot, Average and Cold When finished, we have three sets of numbers. Our Hot set has 20
I want to be perfectly clear about what you can expect using this You see, here’s the thing. You may play this way hundreds of When you don’t win, the Analyse feature will tell you what filter When you wheel 18 numbers, you’re lucky to have all six winning To understand better, you have to try and get past the magical Yes, with random anything can happen. You very well might Not only do all the winning numbers have to be in there. They There are only three ways to seriously target a jackpot. Precise number selection and a small full wheel or key wheel. Well chosen numbers with a jackpot shot (alone or within a wheel). Filtering away everything but the winning combination. Take it from me. It has proven a lot more interesting and economical to make filter choices and play a handful of lines, then trying to predict which numbers are going to win and playing hundreds of lines at a time. Win or lose, every draw is like winning a 4-number prize as I put The best advice I can give you is learning what good software can do, it might surprise you. To visit the Lotwin web site, click their banner below while online.
Similar Posts
|