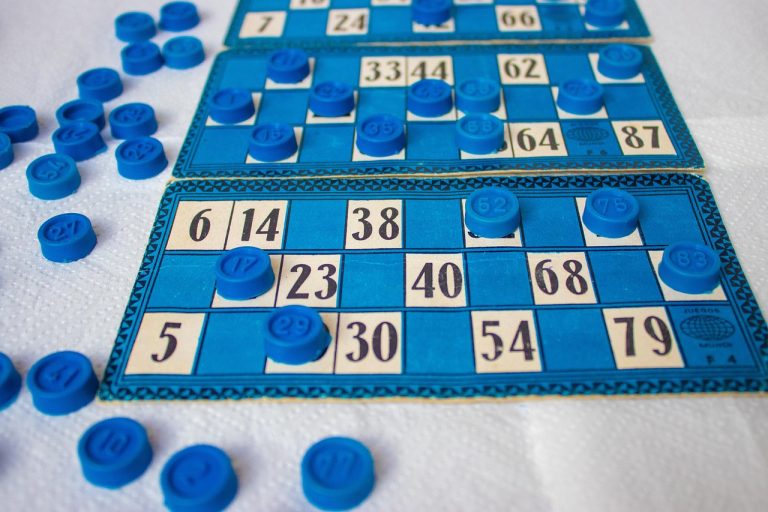


Tips to Improve Your Lottery Play by Robert Perkis
Everybody wants secret lottery tips.
The internet is full of them.
Some are sensible.
Some are harmless.
Some are ridiculous.
And a few seem to have been invented at three in the morning after somebody lost fifty dollars and decided they had discovered a secret system.

Let’s separate reality from wishful thinking.
DON’T EXPECT MIRACLES
The first and most important tip is also the least exciting.
There is no guaranteed way to win the lottery.
If there were, the person who discovered it would be collecting jackpots instead of selling books, courses, videos, software, and subscriptions.
The lottery is designed to be random.
Any advice you receive should be judged against that reality.
That does not mean all lottery tips are useless.
It simply means you should avoid anyone promising impossible results.
AVOID POPULAR NUMBER CHOICES
One of the most repeated lottery tips is also one of the few with solid logic behind it.
Avoid relying entirely on birthdays and anniversaries.
Why?
Because millions of other players do exactly the same thing.
Dates generally limit players to numbers from 1 through 31.
In lotteries where the number field extends beyond that range, many participants ignore a large portion of available numbers.
Using birthdays does not reduce your chances of winning.
However, it may increase your chances of sharing a jackpot if those numbers happen to hit.
And if you are fortunate enough to win, sharing is rarely part of the dream.
AVOID OBVIOUS PATTERNS
Lottery slips seem to encourage creativity.
Some players create diagonal lines.
Others make crosses, squares, circles, or zig-zags.
The problem is that obvious patterns attract other players.
A pattern is no more or less likely to win than any other combination.
The concern is duplication.
The more people who choose the same combination, the greater the chance any future jackpot must be divided among multiple winners.
The lottery machine does not care whether your ticket forms a beautiful pattern.
But your fellow players might.
UNDERSTAND THE DIFFERENCE BETWEEN HOT AND COLD NUMBERS
Many lottery players study previous results.
They look for:
Numbers that appear frequently.
Numbers that have not appeared recently.
Repeating patterns.
Consecutive numbers.
High and low distributions.
Some swear by hot numbers.
Others prefer overdue numbers.
Neither approach changes the fundamental randomness of future drawings.
Still, studying results can help players understand how lottery drawings behave over time.
Just don’t confuse analysis with prediction.
CHECK YOUR TICKETS
This may be the most valuable advice in the entire article.
Check your tickets.
Then check them again.
Every year significant lottery prizes go unclaimed simply because someone forgot they purchased a ticket or failed to verify the results.
A winning ticket has no value if it remains buried in a glove compartment, stuck in a junk drawer, or washed in yesterday’s jeans.
Treat every ticket like cash.
SAVE YOUR TICKETS
Checking tickets is important.
Keeping them is equally important.
In most jurisdictions, a lottery ticket is the proof of ownership.
Without it, claiming a prize may be difficult or impossible.
Sign the back of valuable tickets if your lottery recommends doing so and store them somewhere safe until results are confirmed.
PLAY GAMES YOU UNDERSTAND
Many lottery players jump from one game to another without understanding the rules.
Different games have different:
Ticket prices.
Prize structures.
Odds.
Payout methods.
Expiration dates.
Take a few minutes to understand exactly what you are buying.
A smaller game with more frequent prizes may be more enjoyable than always chasing the biggest jackpot available.
SET A BUDGET
This is perhaps the most overlooked lottery tip of all.
Decide how much you can comfortably afford to spend and stay within that amount.
A lottery ticket should be entertainment.
The excitement of the drawing should never depend on money you cannot afford to lose.
Players who stick to a budget generally enjoy the game far more than those constantly chasing losses.
DON’T IGNORE LUCK
Sooner or later every lottery discussion reaches the subject of luck.
Some people carry lucky coins.
Some wear lucky shirts.
Some consult psychics, astrologers, numerologists, dream books, tarot cards, or fortune tellers.
Will any of these things improve your odds?
Probably not.
Can they make the experience more enjoyable?
Perhaps.
As long as nobody is spending money they can’t afford or expecting magic, a little harmless superstition has always been part of lottery culture.
After all, hope and imagination are part of what makes lottery games fun.
FINAL THOUGHTS
Most lottery tips fall into one of two categories.
Some help you become a smarter player.
Others help you become a happier player.
The smartest players usually combine both.
They understand the rules.
They manage their budget.
They avoid common mistakes.
They check their tickets.
And they never forget that the lottery is supposed to be enjoyable.
Because while winning the jackpot would certainly be nice, enjoying the game along the way isn’t a bad consolation prize.
And here are some tips you don’t see everywhere on the web.

12 Unique Tips & Strategies to Win the Lottery
A Mathematical, Statistical, and Strategic Blueprint for Smarter Play
Chapter 1: The Mathematics of Chance: Deconstructing Odds and House Edge
Every lottery ticket represents an agreement between human optimism and the unyielding laws of probability. Most players participate based on intuition, superstition, or the seductive pull of an astronomical jackpot. However, to approach the lottery with any degree of strategic discipline, you must strip away the marketing, the bright graphics, and the cultural myths, reducing the game to what it actually is: an exercise in pure mathematics.
Understanding the underlying numbers does not merely clarify why winning is so difficult. It provides the essential framework needed to distinguish between viable mathematical edges and sheer fantasy. The mechanics of chance are neither benevolent nor malicious; they are entirely indifferent. To master your relationship with the lottery, you must first master the arithmetic that governs it.
Combinatorial Explosion and the Geometry of Possibility
At the heart of every lottery lies a mathematical branch known as combinatorics, the study of counting, arrangement, and combination. Most people understand that choosing six numbers out of forty-nine yields millions of possible outcomes, but few comprehend the terrifying speed with which these possibilities multiply when slight changes are made to the game matrix. Mathematicians refer to this phenomenon as combinatorial explosion.
In a standard lotto draw where order does not matter and numbers are drawn without replacement, the total number of unique combinations is calculated using the binomial coefficient formula, commonly expressed as n choose k. In this equation, n represents the total pool of numbers available, and k represents the amount of numbers a player must select.
Consider a relatively modest game where you choose six numbers from a pool of forty. The total number of unique six-number combinations is 3,838,380. If the state lottery commission decides to increase the pool by just nine numbers, making it a six-from-forty-nine matrix, the total number of combinations does not rise by twenty or thirty percent. It vaults to 13,983,816. An addition of nine physical ping-pong balls increases the difficulty by more than two hundred and sixty percent.
When operators introduce a secondary pool, such as a bonus ball or power ball drawn from an entirely separate chamber, the math compounds further. In a game requiring five selections from sixty-nine plus one selection from twenty-six, the player faces 11,238,513 combinations from the main barrel alone. Multiplying that figure by the twenty-six variations of the bonus ball results in 292,201,338 distinct combinations. The human brain evolved to grasp tangible quantities, not hundreds of millions. Because we cannot intuitively visualize three hundred million distinct outcomes, we treat a one-in-three-hundred-million chance as roughly equivalent to a one-in-one-million chance. In reality, the difference between those two figures is the difference between a brisk walk and a journey halfway to the moon.
The Fallacy of Memory and Independent Trials
A foundational flaw in common lottery play is the belief that past outcomes exert an influence over future events. Players routinely study charts of hot numbers that have appeared frequently in recent weeks, or cold numbers that have remained absent for months, operating under the assumption that the system possesses a memory that will eventually correct itself.
This psychological trap is known as the gambler’s fallacy. Every physical draw conducted with certified, balanced equipment is an independent trial. If number seventeen was drawn in the last five consecutive games, its mathematical probability of being drawn in the sixth game is precisely identical to the probability of any other number in the barrel. The plastic sphere labeled seventeen has no consciousness, no internal tally of its past appearances, and no inherent desire to restore statistical equilibrium.
Randomness, over an infinite timeframe, does indeed produce an even distribution across all available numbers. This is the law of large numbers. However, human lifetimes and national lotteries operate on a finite, microscopic scale. The law of large numbers dictates what happens across ten million draws, not across the fifty-two draws of a calendar year. Clumping, streaks, and extended absences are entirely normal hallmarks of true randomness. When an individual selects cold numbers because they are due, they are assigning causality to a mechanical system that is explicitly engineered to eliminate all historical continuity.
Deconstructing the House Edge Across Game Tiers
Every commercial game of chance possesses an innate mathematical advantage built into its payout structure, universally known as the house edge. In commercial casino games like blackjack or baccarat, the house edge is notoriously slim, often lingering between one and three percent. In roulette, it climbs to around five percent. Lotteries, by stark contrast, impose the most aggressive house edge in the entire regulated gambling industry.
The house edge represents the percentage of total wagered capital that the game operator keeps as gross profit, administrative overhead, and civic contributions before returning the remainder to the player pool as prizes. In the majority of jurisdiction-run lotteries, this rake ranges from forty to sixty percent. For every dollar spent by the public on tickets, only forty to sixty cents is allocated toward funding the prize tiers.
Understanding how this edge distributes across different styles of lottery games is vital for anyone seeking to minimize their mathematical disadvantage.
Terminal-based daily numbers games, such as Pick 3 and Pick 4, offer players significantly better odds of winning a top prize than multi-state jackpot drawings. A standard Pick 3 game with straight betting requires you to guess a three-digit sequence from 000 to 999, creating exactly one thousand possible outcomes. The true mathematical odds of winning are one in one thousand. However, the standard payout for a successful one-dollar straight ticket is not one thousand dollars; it is typically five hundred dollars. The house keeps fifty cents of every dollar wagered, locking in a fifty percent house edge regardless of how many tickets are sold.
Instant scratch-off tickets employ a different mechanical structure altogether. Unlike draw games, where the total number of winners cannot be known until the draw takes place, scratch-off games are manufactured in pre-determined batches known as pools or runs. Each pool contains a precisely engineered distribution of winning and losing tickets. While scratch-off tickets often boast more attractive overall odds of winning something—frequently marketed as roughly one in four—the lower tiers of those prizes are almost entirely composed of break-even amounts, such as winning a two-dollar prize on a two-dollar ticket. These pseudo-wins serve to recycle player capital back into the machine while disguising an operational house edge that typically sits between twenty and thirty-five percent on higher-denomination tickets, and upwards of forty percent on entry-level one-dollar tickets.
Large-format jackpot games utilize a parimutuel prize model for their grand prizes, where the jackpot rolls over and compounds if no ticket matches the complete sequence. Here, the house edge is absolute and unshifting on the non-jackpot secondary prizes, but the apparent edge of the grand prize fluctuates wildly based on ticket sales, accumulated jackpot equity, and macroeconomic factors.
The Architecture of Expected Value
To objectively measure whether a wager is mathematically sound, professional analysts rely on a fundamental metric called expected value, abbreviated as EV. Expected value calculates the average return you can anticipate on a given bet if that exact bet were repeated an infinite number of times under identical conditions. A negative expected value indicates a mathematically guaranteed long-term loss, while a positive expected value indicates a profitable mathematical proposition.
Calculating the expected value of a lottery ticket involves multiplying the payout of every possible prize tier by the exact probability of hitting that tier, summing those values together, and then subtracting the initial cost of the ticket.
In virtually every standard drawing, the expected value of a lottery ticket is profoundly negative. If a ticket costs two dollars, the baseline mathematical value of the prizes it represents might equal only eighty cents, meaning that the moment you purchase the ticket, you realize an immediate forty percent mathematical loss on your capital.
There are, however, rare anomalies where soaring, multi-week rollovers cause the nominal jackpot to grow so large that the expected value equation flips from negative to positive. If a jackpot climbs to a billion dollars, the mathematical return on a two-dollar investment appears, on paper, to exceed two dollars.
Yet, treating this scenario as a straightforward mathematical windfall ignores three critical real-world variables that permanently depress the real expected value of a ticket: the cash option discount, tax liabilities, and the risk of jackpot fragmentation.
The advertised jackpot of a mega-draw is an illusion born of compound interest; it represents an annuity paid out across twenty-nine or thirty years, funded by long-term government bonds. If a winner elects to take an immediate lump-sum payment, the prize instantly contracts by forty to fifty percent of the advertised sticker price. Once that reduced cash sum is established, federal, state, and local taxation claws back an additional thirty-seven percent or more of the remaining capital.
The third and most volatile factor is jackpot fragmentation, commonly known as a split pot. As the headline prize swells, public participation increases exponentially. When ticket sales spike into the tens of millions, the probability that multiple tickets will match the winning combination rises sharply. If two or three individuals hold the winning numbers, the jackpot is cleaved into halves or thirds, annihilating the theoretical positive expected value that prompted the play in the first place. When these three variables are factored into the equation, true positive expected value draws become extraordinarily rare historical occurrences.
The Strategic Reality of the Math
Internalizing the mathematics of chance changes your strategic posture. You no longer view the lottery as a magical shortcut to wealth, nor do you view it through the lens of lucky charms, birth dates, or prophetic dreams. You recognize it as a rigid system bounded by combinatorics, burdened by a steep house edge, and governed by cold independence.
This realization does not mean you must abandon the lottery entirely. Instead, it provides the baseline from which all rational engagement must originate. By understanding combinations, you learn how to avoid shared-number traps that destroy payout values. By respecting independent trials, you cease wasting financial resources on systems that attempt to predict the unpredictable. By quantifying the house edge, you learn to identify which formats preserve capital and which formats devour it.
Before you can engineer any advantage, you must accept the mathematics on its own terms. Every successful strategy documented throughout the history of numbers games began not with a desire to outsmart the universe, but with a rigorous, uncompromising respect for the balance sheet of chance.
—
Chapter 2: Strategy 1: Exploiting Positive Expected Value (+EV) Rollovers
In standard market conditions, the lottery is designed to be a mathematically unbeatable game. Every ticket purchased carries a negative expected value, meaning that over an infinite timeline, an individual is guaranteed to lose a predictable percentage of their capital. In most state-run lotteries, this house edge hovers between thirty-five and fifty percent. For every two-dollar ticket sold, approximately one dollar is retained by the state for educational funding, administrative overhead, and retail commissions, leaving the remaining dollar in the collective prize pool.
Yet, this dynamic is not entirely static. The mathematical foundation of a lottery relies on the assumption of independent trials and constant odds. While the odds of selecting a winning combination never change, the payoff associated with those odds changes constantly. When consecutive drawings pass without a jackpot winner, the unclaimed capital rolls over into subsequent prize pools. Under specific, mathematically quantifiable circumstances, these rollovers elevate the aggregate payout to a threshold where the house edge vanishes, and the expected value of a single ticket shifts from negative to positive.
Understanding the Mechanics of Expected Value
Expected value represents the long-term average outcome of a given decision when that decision is repeated under identical conditions. In financial analysis, a positive expected value, commonly denoted as positive EV, indicates an investment whose anticipated returns exceed the cost of entry.
To determine the expected value of a lottery ticket, one must multiply the probability of winning each individual prize tier by the cash value of that tier, sum those values across all possible outcomes, and subtract the retail price of the ticket. In standard drawings, the total sum of these probabilities and payoffs falls far short of the purchase price. A two-dollar ticket might hold a mathematical value of only eighty-five cents.
However, as the top-tier prize compounds through dozens of rollovers, its weight within the expected value equation expands dramatically. If the odds of hitting the jackpot in a particular game are one in forty-five million, and the advertised jackpot reaches ninety million dollars, the nominal value of the jackpot alone appears to equal two dollars per combination. When secondary prizes are added to the equation, the nominal expected value crosses into positive territory. At this inflection point, the mathematical expectation shifts in favor of the bettor.
The Pitfalls of Nominal Calculations
Calculating genuine positive expected value requires far more discipline than simply comparing the advertised jackpot against the odds of winning. Novice players routinely make the mistake of relying on headline figures, falling prey to two variables that degrade the mathematical edge: tax obligations and the probability of shared jackpots.
Advertised lottery jackpots are almost universally displayed as thirty-year annuity estimates rather than actual liquid capital. The true cash value of a jackpot is typically forty to fifty percent lower than the advertised figure. Furthermore, federal, state, and local income taxes will claim a substantial portion of any lump-sum distribution. Any rigorous calculation of expected value must be conducted using the post-tax, lump-sum payout rather than the nominal figure displayed on billboards.
The second and more dangerous variable is the co-winner discount. When jackpots swell to historic sizes, public participation increases exponentially. A massive surge in ticket sales directly increases the mathematical likelihood that multiple players will select the exact same winning sequence. If two or three players match the winning numbers, the jackpot is split evenly, cutting each winner’s payout by half or two-thirds.
Sophisticated analysts calculate the Poisson distribution of ticket sales to project the expected number of winning tickets in a given draw. As ticket sales saturate the field of possible combinations, the risk of splitting the jackpot accelerates, often dragging an apparent positive expected value back into negative territory. True mathematical opportunity exists not merely when the jackpot is large, but when it is large relative to the volume of public participation.
The Syndicate Paradigm and Historic Exploitations
The concept of exploiting positive expected value rollovers is not merely theoretical. It has been executed with remarkable precision by organized syndicates throughout modern lottery history.
One of the most notable pioneers of this methodology was Stefan Mandel, an economist who successfully captured multiple international lotteries before targeting the Virginia State Lottery in 1992. The Virginia game possessed unique structural characteristics: the total number of combinations was relatively small—approximately 7.1 million—and the state allowed players to print their bet slips at home and purchase tickets in massive bulk.
When the Virginia jackpot rolled over to twenty-seven million dollars, Mandel established an international syndicate, raising funds from thousands of investors. Because the prize pool significantly outweighed the seven-point-one million dollars required to buy every single combination, Mandel’s operation purchased almost the entire field. Despite intense logistical challenges, his team successfully submitted the winning combination, capturing the top prize alongside hundreds of thousands of dollars in secondary and tertiary payouts.
A more recent and structurally pure exploitation occurred in the Massachusetts Cash WinFall and Michigan Winfall lotteries during the early 2000s. These games featured a unique structural rule known as a roll-down. If the jackpot reached an upper limit—typically two million dollars in Massachusetts—and no player matched all six numbers, the grand prize was not held over. Instead, the money rolled down to augment the prizes for the lower tiers, significantly boosting the payouts for matching three, four, or five numbers.
A group of applied mathematics students from the Massachusetts Institute of Technology, alongside a separate syndicate operated by Jerry and Marge Selbee, recognized that during roll-down weeks, the game achieved a mathematically indisputable positive expected value without relying on the astronomical odds of hitting the grand prize. By purchasing hundreds of thousands of tickets during these specific windows, the syndicates effectively transformed the lottery into a statistical arbitrage machine, capturing consistent, risk-mitigated returns across thousands of lower-tier payouts.
The Operational Reality of Execution
For an individual or syndicate seeking to capitalize on positive expected value, the challenge rapidly evolves from a mathematical exercise into an operational and logistical endeavor.
Possessing a statistical edge does not eliminate variance. In standard lotteries where the positive value is concentrated in the top prize, an individual purchasing a handful of tickets still faces near-certain capital destruction. The law of large numbers dictates that an edge only materializes over a massive sample size. Without the capital reserves to purchase an overwhelming volume of tickets, a bettor remains subject to the extreme variance of the game.
Moreover, purchasing hundreds of thousands of physical tickets introduces severe operational vulnerabilities. In many modern jurisdictions, automated bet-slip processing is legally restricted or outright prohibited. Tickets must be manually printed and processed by retail terminals. The logistical burden of printing, verifying, financing, and physically securing millions of pieces of paper within the forty-eight to seventy-two-hour window between drawings requires military-grade planning.
Retail terminal jams, ink depletion, cash limits, and simple human error can derail an operation. If a syndicate aims to cover the entire combinatorial space and misses even one percent of the possible combinations due to processing delays, that missing one percent could very well contain the winning sequence.
Strategic Implementation for Serious Observers
For those analyzing lottery structures without the institutional backing of a syndicate, tracking positive expected value serves as the ultimate filter for participation. The fundamental rule of positive EV strategy is simple: play only when the mathematics justify the expenditure.
This demands strict abstinence during standard drawings, regardless of convenience or habit. A player must establish precise quantitative thresholds that account for post-tax lump sums, secondary tier distributions, and estimated ticket sales. If the calculated post-tax expected return per ticket does not comfortably exceed the purchase price, capital must remain preservation-focused and deployed elsewhere.
When an authentic positive EV window opens, the strategic player minimizes the co-winner discount by deliberately avoiding common human selection patterns. Most casual participants select numbers based on birthdays, calendar days, or visual patterns on the play slip, creating an unnatural concentration of selections between the numbers one and thirty-one. By selecting randomly distributed combinations across the entire number matrix, a player does not change their odds of winning, but they significantly reduce the probability of sharing the jackpot if their numbers are drawn.
Exploiting rollovers is not an act of luck or intuition. It is the cold, disciplined application of financial mathematics to a system that temporarily misprices its own risk. By understanding where the boundary lies between consumer gambling and statistical expectation, one ceases to play the lottery as a hopeful participant and begins to view it as an asset class waiting for a market inefficiency.
—
Chapter 3: Strategy 2: The Game Selection Matrix—Targeting Favorable Odds
The glittering allure of a nine-figure jackpot has an undeniable psychological pull. Billboards blaze with numbers so large they seem abstract, and news cycles amplify the frenzy until millions of casual players line up at convenience store counters, clutching fresh cash for a slip of paper. What most participants fail to realize is that the lottery operators engineered this exact spectacle. By steadily expanding the number pools over the past decade, organizers deliberately made grand prizes nearly impossible to hit. In doing so, they created multi-month rollovers that drive feverish ticket sales, while quietly reducing the average player to the worst mathematical proposition in modern gaming.
To approach the lottery with any degree of discipline, you must strip away the marketing spectacle and look strictly at the mechanics of probability. Winning is not a single, uniform concept; it is an equation governed by the size of the number field, the structure of the prize tiers, and the cost of entry. When you evaluate games through this lens, the mega-draws like Powerball and Mega Millions quickly lose their shine, revealing that the true tactical opportunities lie far closer to home.
The Illusion of the Mega-Jackpot
Consider the raw mathematics of an American multi-state drawing. With odds sitting around one in two hundred and ninety-two million for Powerball and one in three hundred and two million for Mega Millions, the likelihood of securing the top prize is essentially indistinguishable from zero on a standard probability graph. To put those figures into perspective, you are far more likely to be struck by lightning twice, become an astronaut, or find a pearl in an oyster at dinner than you are to hold the single matching ticket.
Beyond the catastrophic odds, the financial structure of these colossal drawings works aggressively against the ticket holder. First, advertised jackpots represent forty-year annuity streams, meaning that taking a lump-sum cash option immediately strips away thirty to forty percent of the stated headline value before taxes are even calculated. Second, as jackpots balloon past half a billion dollars, ticket volume surges exponentially. This surge introduces a massive risk of split pots, where multiple players select the same winning combination, instantly halving or quartering your return.
Most critically, these national games feature a highly top-heavy prize architecture. The vast majority of the prize pool is locked into the elusive top tier, while the lower tiers offer payouts that barely outpace the cost of buying the ticket. You are essentially financing an astronomical prize you will never win, subsidized by an ongoing sequence of near-guaranteed losses.
The Hidden Efficiency of Regional and Daily Games
When you shift your attention away from national drawings and examine state-level offerings, the mathematical terrain alters dramatically. A state-run five-number game—often branded under names like Cash 5, Fantasy 5, or Badger 5—typically operates with a pool ranging from thirty-five to forty-three numbers.
The difference in magnitude is staggering. Instead of facing odds of one in three hundred million, the top prize in a five-of-thirty-nine game carries odds of approximately one in five hundred and seventy-five thousand. While a jackpot of one hundred thousand dollars or three hundred thousand dollars lacks the private-jet glamour of a national drawing, the mathematical hurdle is reduced by more than five hundred times.
Even further down the spectrum are daily pick-games, such as Pick 3 and Pick 4. A standard Pick 4 straight bet offers odds of one in ten thousand for a payout that typically sits around five thousand dollars on a one-dollar ticket. These games operate on pure, static mathematical combinations without the wild variance introduced by dynamic ticket-sales spikes. By selecting games with smaller fields and tighter odds, your capital works substantially harder, generating more frequent returns that keep your bankroll functional rather than rapidly depleting it.
The Core Metrics of the Selection Matrix
To systematically identify which games deserve your capital, you must implement an objective scoring system. The Game Selection Matrix relies on four distinct parameters to evaluate any lottery product available in your jurisdiction.
The first parameter is Jackpot Probability. This is the absolute mathematical hurdle required to capture the top prize. Games with odds longer than one in ten million score poorly, while games with odds tighter than one in one million receive high marks.
The second parameter is Overall Win Probability. Every game publishes the odds of winning any prize whatsoever, from a free ticket to a secondary cash reward. A game where one in eight tickets wins something provides far better bankroll preservation than a game where only one in thirty-five tickets yields a return.
The third parameter is Prize Distribution Equity. This metric evaluates how much of the prize fund is allocated to mid-tier prizes rather than concentrated entirely in the grand jackpot. A healthy game provides secondary tiers that deliver meaningful returns, such as five thousand or ten thousand dollars, rather than collapsing immediately from millions down to a ten-dollar consolation prize.
The fourth parameter is Payout Mechanism, contrasting fixed-payout formats with pari-mutuel systems. Fixed payouts guarantee a set dollar return regardless of how many other participants hold winning tickets, shielding you from diluted rewards during high-volume drawings. Pari-mutuel systems, while capable of generating large prizes, carry inherent instability because payouts fluctuate based on total sales and the number of concurrent winners.
Evaluating Your Local Portfolio
To put the matrix into practice, gather the official game disclosure sheets provided by your regional lottery commission, which are publicly available online or at retail kiosks. For each game offered, assign a value from one to ten across the four core metrics, with ten representing the most favorable condition for the player.
When you score a national game like Powerball, the results are sobering. Jackpot Probability receives a one, the lowest possible score, due to the astronomical pool size. Overall Win Probability scores moderately, around a four, because small two-dollar and four-dollar prizes are sprinkled across the lower tiers. Prize Distribution Equity scores a two, as the overwhelming mass of revenue is dedicated solely to fueling the top jackpot. Payout Mechanism sits at a five, reflecting fixed secondary prizes balanced against an unstable, shared grand prize. The total composite score places the game at the very bottom of your strategic options.
Conversely, consider a typical state-run rolling cash game. Jackpot Probability scores a seven, thanks to manageable odds that frequently hover between one in three hundred thousand and one in eight hundred thousand. Overall Win Probability typically scores a six or seven, supported by a compact number field. Prize Distribution Equity frequently rates an eight, as matching three or four numbers yields substantial, bankroll-building payouts relative to ticket cost. With a composite score nearly double that of the national alternative, the regional game establishes itself as the superior vehicle for structured play.
Strategic Capital Allocation
Transitioning to an odds-focused approach requires a deliberate reallocation of your wagering budget. Players who treat the lottery as a blind gamble routinely dump their entire monthly spend into whatever game currently features the highest billboard number. A disciplined player operates like an asset allocator.
The foundation of your strategy should involve directing eighty percent of your lottery capital toward games that achieve the highest scores in your matrix. These are your regional five-digit drawings, select daily numbers games, or localized six-number drawings with low matrix sizes. In these environments, your capital encounters the least mathematical resistance, maximizing your exposure to meaningful secondary wins and mathematically viable jackpots.
The remaining twenty percent of your budget may be reserved for speculative opportunities. If a national lottery jackpot rolls over to a point where mathematical expectation approaches positive territory—a rare phenomenon occurring only when jackpots cross historically massive thresholds—small, controlled participation can be justified. However, this participation should be viewed as an occasional, calculated foray rather than the core of your regular play.
The Discipline of Exclusion
A critical component of game selection is knowing what to eliminate entirely. Scratch-off tickets, for instance, frequently present a tempting overall win rate, but they carry an aggressive house edge that erodes capital faster than almost any terminal-drawn game. Furthermore, scratch tickets do not allow for combinatorial analysis or strategic number distribution; their outcomes are predetermined at the moment of printing.
Similarly, games that feature add-on multipliers often present a deceptive value proposition. While paying an extra dollar to double or triple a secondary prize sounds appealing, it fundamentally increases your cost per play by fifty to one hundred percent without improving your fundamental probability of winning the underlying prize. The matrix demands efficiency, and unnecessary add-ons siphon capital that would be far better spent securing additional independent combinations in favorable primary drawings.
By committing your funds exclusively to games that pass rigorous mathematical inspection, you step outside the crowd of wishful dreamers. You cease to be a passive consumer of multi-million-dollar marketing campaigns and instead become a calculated participant, deploying resources where the odds are most compressed, the payouts are most equitable, and the probability of real financial return is at its absolute highest.
—
Chapter 4: Strategy 3: Combinatorial Wheeling Systems for Guaranteed Tier Payouts
Most lottery participants approach the ticket counter with an isolated mindset. They treat each six-number ticket as an autonomous island, uncorrelated with any other line they purchase. If they buy five tickets, they hold thirty independent selections, frequently duplicating numbers without purpose or scattering their picks so broadly that their chances of concentrating winning numbers on a single line remain microscopically low. This fragmented approach explains why so many players occasionally guess four or five of the winning numbers across their total purchase, yet walk away with empty pockets because those numbers were distributed across separate tickets.
Combinatorial wheeling systems replace this scattershot behavior with structured combinatorial design. Originally engineered by European mathematicians and popularized by syndicate managers, wheeling is a method of arranging a targeted pool of numbers across a predetermined grid of tickets. The objective is not magical prescience, but deterministic efficiency. When properly constructed, a wheel provides a mathematical guarantee: if a specified quantity of the winning numbers falls within your chosen candidate pool, you are guaranteed to capture a predetermined tier prize, with a residual probability of winning the jackpot itself.
The Architecture of a Guarantee
Every lottery wheel is defined by four core metrics, often written in standard notation as a wheeling formula: numbers chosen, ticket size, match guarantee, and drawn condition. For instance, a system described as a three-if-four wheel over twelve numbers means that you select a master pool of twelve candidate numbers. As long as at least four of the official drawn numbers are contained within your twelve-number pool, the resulting tickets mathematically guarantee at least one winning line of three numbers.
This architecture works through balanced incomplete block designs, an area of finite mathematics that systematically balances the co-occurrence of elements in subsets. Instead of hoping your numbers land together by chance, the system ensures that every pair, triplet, or quartet within your pool appears on a ticket together a calculated number of times.
The power of this method lies in the elimination of waste. When an unorganized player picks twelve numbers across two standard six-number tickets, they cover only two permutations of the 924 possible six-number combinations that those twelve digits can form. If three winning numbers land on the first ticket and three land on the second, the player wins nothing. A wheeling system distributes those twelve numbers across a specific series of lines so that winning numbers are forced to intersect.
Full Wheeling Systems
The most comprehensive framework is the full wheel. A full wheel generates every single mathematical combination possible from your chosen pool of numbers. If you select eight numbers in a standard pick-six lottery, the number of six-digit combinations that can be formed from that pool is precisely twenty-eight. Playing a full wheel means buying all twenty-eight tickets.
The primary advantage of the full wheel is absolute capture. If all six winning numbers appear within your pool of eight, you do not simply win the jackpot; you also win twelve prizes for matching five numbers, and fifteen prizes for matching four numbers. The returns compound dramatically because of the overlapping nature of the lines.
The limitation of the full wheel is financial scalability. Combinatorial expansion is ruthless. While wheeling eight numbers requires twenty-eight tickets, expanding that pool to ten numbers requires 210 tickets. Wheeling twelve numbers escalates to 924 tickets, and wheeling fifteen numbers requires 5,005 tickets. For an individual bettor, the full wheel rapidly outgrows sensible bankroll parameters. Consequently, full wheels are primarily utilized by structured syndicates with deep capital reserves, or applied to smaller pool selections where the number count remains strictly bounded.
Abbreviated Wheeling Systems
To capture the structural benefits of wheeling without succumbing to exponential ticket costs, mathematicians developed abbreviated wheels. An abbreviated wheel selectively removes redundant combinations from a full wheel while rigorously maintaining a guaranteed minimum payout floor.
In an abbreviated design, you accept a controlled tradeoff. You surrender the certainty of the top-tier jackpot in exchange for a drastic reduction in ticket overhead, while preserving a absolute guarantee on lower-tier returns. For example, playing ten numbers in a full pick-six wheel demands 210 tickets. An abbreviated wheel covering those same ten numbers can guarantee a four-number payout—assuming four winning numbers fall in your pool—with as few as ten tickets.
This ninety-five percent reduction in cost alters the sustainability of lottery play. You retain the ability to track a broad set of candidate numbers, and if your predictive screening captures the winning digits, you are mathematically protected against the frustration of having those numbers fragmented across losing lines. Furthermore, abbreviated wheels do not eliminate the jackpot entirely; they merely reduce the probability of hitting it to a calculated percentage, often between five and fifteen percent, while ensuring the secondary tiers pay out reliably to replenish your bankroll.
Key Number Wheels
For players who operate with high conviction regarding one or two specific numbers, key number wheels—often called power wheels or banker wheels—represent the most capital-efficient architecture available.
A key number wheel requires you to designate one or more core digits that must appear on every single ticket generated by the system. The remaining positions on each ticket are then systematically wheeled using your secondary pool of candidate numbers.
Consider an individual who holds strong conviction that the numbers 7 and 23 will be drawn. In a six-number format, those two numbers are locked into the first two slots of every line. The remaining four slots are then wheeled across a pool of eight secondary selections. Because the key numbers absorb two variables on every ticket, the total number of lines required to achieve a comprehensive guarantee drops precipitously compared to a standard abbreviated wheel.
The leverage provided by a key wheel is formidable, but it introduces an acute structural vulnerability. If your key numbers hit, your payouts multiply exponentially across multiple tickets, as the fixed core connects with various wheeled combinations. However, if even one of your key numbers fails to be drawn, the entire wheel collapses, nullifying the guarantees of the secondary pool. Key wheels are precision instruments, appropriate only when historical trend analysis, frequency tracking, or positional modeling gives you statistical justification to anchor specific digits.
Constructing and Executing a System
To execute a combinatorial wheel effectively, you must avoid arbitrary ticket compilation. A valid wheel relies on rigorous mathematical tables rather than intuition. Attempting to draft a wheel by eye invariably leads to coverage gaps where certain number pairings are omitted while others are repeated needlessly.
The initial step requires defining your pool size based strictly on your bankroll constraints rather than optimism. Determine the capital allocated for a given draw cycle, identify the ticket cost, and match that total against an established wheeling table. If your budget allows for fifteen lines, locate an abbreviated wheel designed precisely for fifteen combinations, noting its explicit guarantee, such as three-if-four or four-if-six.
Once the template is selected, assign your candidate numbers to the index positions of the wheel. If a master grid calls for positions one through ten distributed across eight combinations, you simply substitute your chosen digits into the corresponding numeric slots on the grid. Every ticket is transcribed systematically from the resulting matrix.
Discipline in this phase requires total adherence to the grid. Modifying a single line to indulge a secondary hunch dismantles the integrity of the combinatorial balance, instantly voiding the mathematical floor that the system was built to provide.
Strategic Integration
Combinatorial wheeling is not an independent engine that generates winning numbers from thin air. It is a transmission system that converts correct number identification into guaranteed monetary recovery. A wheel applied to a poorly selected pool of numbers simply accelerates losses in a highly organized fashion.
The true utility of wheeling emerges when it is married to an intelligent filtering strategy. By using statistical criteria—such as eliminating extreme odd-even imbalances, filtering out consecutive sequences that exceed historical norms, and curating a pool that reflects balanced sum ranges—you narrow the field. Once that refined candidate pool is established, the wheel steps in to perform the engineering work. It ensures that when your macro-analysis is correct, the micro-distribution of numbers on your tickets will not betray your effort.
—
Chapter 5: Strategy 4: The Anti-Popularity Selection Protocol to Avoid Split Jackpots
When a player walks past a lottery terminal displaying a headline jackpot of three hundred million dollars, their imagination invariably casts them as the sole architect of that windfall. They envision writing a single resignation letter, purchasing a single estate, and stepping into complete financial autonomy. The lottery operator, however, knows a fundamental truth that most participants overlook: the advertised jackpot is not a guaranteed individual payout. It is a shared prize pool, and if three, five, or twelve other tickets bear those identical digits, the prize dissolves into fractions before the tax authorities ever claim their share.
Winning the lottery is statistically extraordinary, but winning a fraction of a lottery jackpot due to predictable human behavior is a self-inflicted strategic tragedy. To treat the lottery with professional rigor, one must understand that there are two distinct variables in play during every drawing: the probability of your numbers appearing, and the probability of someone else having chosen them. While you cannot alter the former, you can exert absolute control over the latter.
The Mathematics of Shared Fortune
Every combination of numbers in a standard lottery drawing has the exact same probability of being selected by the mechanical draw machine or random number generator. A combination consisting of 1, 2, 3, 4, 5, and 6 has the exact same odds of falling into the chute as 14, 27, 38, 49, 52, and 61. The physical equipment does not possess aesthetic preferences, cultural superstitions, or emotional attachments. It is indifferent to symmetry.
The player base, however, is not indifferent. Human beings are remarkably un-random when asked to generate arbitrary sequences. When hundreds of thousands of people manually fill out play slips, their selections cluster around specific cognitive attractors. This clustering creates an uneven distribution of player capital across the total combinatorial field.
If a popular cluster of numbers is drawn, the jackpot is divided among dozens of winning tickets, reducing an advertised grand prize of fifty million dollars to a pedestrian payout. Conversely, if a deeply unpopular combination is drawn, the lone winner captures the entire sum. The odds of the combination hitting were identical in both scenarios, but the economic yield was vastly different. Strategy in a pari-mutuel game is not about improving the chance of the event occurring; it is about maximizing the payout conditional on the event occurring.
The Cognitive Traps of the Human Mind
To construct a ticket that isolates you from the crowd, you must first catalog the psychological habits of the average bettor. The most prevalent cognitive bias in lottery participation is calendar-based selection, commonly known as the birthday bias.
Because people inherently select anniversaries, birthdates of children, and meaningful calendar milestones, numbers between 1 and 31 are selected at a frequency several orders of magnitude higher than numbers between 32 and 70. In games like Powerball or Mega Millions, where the field extends well into the sixties and seventies, the numbers residing above 31 are treated by the average player as vast, empty deserts. By limiting selections to dates of personal significance, the casual player base effectively packs the majority of their choices into less than half of the available number field.
The second cognitive trap is visual and spatial patterning. When presented with a grid on a physical paper slip, human players instinctively treat the slip as a canvas. They make diagonals, zig-zags, four-corner boxes, vertical lines, and cross shapes. They deliberately space numbers out to look balanced, under the false intuition that random selections appear neat and evenly distributed.
The third trap is numerical superstition. Numbers such as 7, 3, 11, and 9 carry immense cultural prestige across Western societies. In other cultures, numbers like 8 are disproportionately favored due to associations with prosperity. Conversely, numbers like 13 are avoided by some, yet chosen with surprising frequency by contrarians who believe they are outsmarting superstition. Sequential numbers, such as consecutive integers or simple arithmetic progressions like multiples of five, are also routinely played by thousands of individuals who consider the choice whimsical or ironic.
Real-World Catastrophes of Consensus
The cost of choosing popular numbers is not theoretical; it is recorded throughout lottery history. In numerous international lotteries, draws that have produced simple visual patterns or obvious sequences have yielded administrative nightmares for the players involved.
Consider an instance where a drawing produces numbers that mimic a popular fictional sequence, such as the numbers famously featured in a long-running television drama, or a simple sequence of consecutive numbers. When these draws hit, the operators do not hand out millions to a single lucky soul. Instead, hundreds, and sometimes thousands, of ticket holders emerge from the woodwork. Second-tier prizes meant to reward players with life-changing secondary sums are diluted into negligible amounts, and jackpots that should have elevated a winner into the upper tier of global wealth are reduced to sums that barely pay off a modest mortgage.
A ticket that duplicates another ticket has negative strategic utility. If you buy a ticket that twenty other people are holding, you are effectively accepting the astronomical odds of the lottery while volunteering for a ninety-five percent reduction in prize equity.
The Mechanics of the Anti-Popularity Protocol
The anti-popularity protocol is a systematic method of selecting numbers designed to ensure that if your combination is drawn, you will stand alone on the winner podium. It requires a deliberate, disciplined rejection of the cognitive habits shared by the casual public.
First, anchor your selection heavily above the calendar threshold. In any lottery format where the maximum number exceeds 31, the majority of your chosen numbers should sit between 32 and the upper boundary of the matrix. While a combination composed entirely of numbers above 31 has the same odds of hitting as one composed entirely of numbers below 31, the probability of having to split the jackpot drops precipitously with every high number introduced into the line.
Second, disrupt arithmetic and visual order. Do not pick numbers that follow a clear spacing interval, such as intervals of four, six, or ten. Avoid combinations that form tidy geometric shapes on the paper play slip. True randomness is messy, clustered, and visually unsatisfying to human eyes. It often features two consecutive numbers sitting directly beside each other, followed by a wide, awkward gap, followed by another cluster. If your ticket looks pleasing or organized, it is statistically likely that thousands of other players found it pleasing as well.
Third, purge cultural and pop-culture references entirely. Never use numbers derived from famous lottery lore, viral media, historical calendar years, or universally recognized lucky charms.
Fourth, treat the bonus ball or secondary matrix with the same rigor. Casual players often treat the final single digit—such as the Powerball or Mega Ball—as an afterthought, frequently defaulting back to single-digit favorites like 7 or 8. Choosing a higher, mathematically neutral value for your secondary number ensures protection across both the jackpot and the tiered down-ball payouts.
The Quick Pick Paradox
A common objection to manual anti-popularity selection is the availability of the machine-generated Quick Pick. Proponents argue that allowing the terminal to generate an arbitrary sequence removes human bias automatically.
While Quick Picks are unquestionably superior to birthday-based manual entries, they present a subtle strategic vulnerability: they are blind to the selections of other players. A terminal algorithm distributes numbers across the board using internal random number generators, but it makes no conscious effort to steer away from the heavy clusters created by manual players. More importantly, terminal algorithms can and do generate popular sequences, calendar-dense lines, and aesthetic groupings purely by chance.
The anti-popularity protocol is not merely the pursuit of randomness; it is the intentional evasion of human consensus. A purely random generator does not care if it assigns you five numbers under thirty-one. You, as an informed strategist, do care. Manual entry, applied through an anti-popularity framework, is the only way to actively guarantee that your ticket resides in the lowest density quadrant of player selections.
Executing the Strategy
To put this protocol into practice, review the exact numerical boundaries of your target game. Divide the primary matrix into two zones: the common zone from 1 to 31, and the unpopulated zone from 32 to the maximum allowable integer.
When composing your lines, ensure that no more than one or two numbers, at most, originate from the common zone. The remaining positions must be populated from the unpopulated zone. As you place your numbers, observe the physical slip. If you detect a triangle, a line, or a recognizable sequence taking shape, dismantle it immediately. Embrace combinations that feel counterintuitive, irregular, and devoid of sentimental resonance.
You must remember that you cannot charm the machine into drawing your numbers. The lottery remains an uncompromising game of absolute chance where the house holds a steep mathematical advantage. However, if that rare, lightning-strike moment occurs and your numbers are drawn, the anti-popularity protocol ensures that the wealth is exclusively yours. You will not share your fortune with the crowd, because you had the discipline not to think like them.
—
Chapter 6: Strategy 5: High-Performance Syndicate Architecture
The individual lottery participant faces a fundamental mathematical obstacle: an infinitesimally small probability distribution paired with limited capital. While purchasing a handful of tickets marginally shifts your odds away from zero, it leaves the vast mathematical reality of the game unaltered. To overcome this limitation, serious players turn to collective scale. By combining purchasing power, a syndicate transforms an individual speculative play into a disciplined, high-volume operation capable of securing meaningful mathematical coverage across a single drawing.
Yet scale introduces human complexity. History is replete with informal syndicates that dissolved into acrimony, multi-year litigation, or financial ruin precisely at the moment of victory. When seven- or eight-figure sums are suddenly on the table, friendships and casual verbal understandings evaporate under the weight of tax audits, disputed contributions, and contested ownership. A high-performance syndicate is therefore equal parts mathematical architecture and legal fortification. To function effectively, it must be constructed with the precision of a corporate joint venture.
The Mathematics of Collective Scale
The primary benefit of a syndicate is not simply that it buys more tickets, but that it allows for coordinated coverage. When twenty individuals buy five tickets each on their own, their selections almost invariably overlap, relying on the same popular dates, lucky numbers, and random quick-picks. This redundancy dilutes collective leverage. In contrast, an organized syndicate aggregates that exact same capital to purchase one hundred unique, mathematically deliberate combinations.
Through this coordinated volume, a syndicate can deploy wheeling systems and systematic entries that are economically impossible for an individual. A wheeling system arranges a chosen group of numbers into combinations that guarantee a specific payout if a subset of those numbers is drawn. For example, rather than hoping five randomly chosen numbers match the winning sequence, a syndicate can cover an expanded pool of twelve or fourteen numbers across dozens of permutations. This strategic clustering dramatically increases the probability of capturing secondary and tertiary prize tiers, which provide cash flow to subsidize future entries while preserving full upside for the jackpot.
Scale also allows the group to participate in draws only when the mathematical expectation reaches its highest efficiency. By pooling capital into a dedicated treasury, a syndicate can conserve its resources during baseline jackpots and deploy heavy, coordinated volume precisely when roll-overs generate positive expected value or when promotional events offer enhanced payouts.
The Charter and Legal Safeguards
No syndicate should ever purchase a single ticket without an ironclad, written operating agreement signed by every participant. In the eyes of the law, an unwritten agreement regarding a winning ticket is an invitation to chaos. The courts will look at physical possession of the ticket, bank records, and witness testimony, creating an environment where a single disgruntled coworker or estranged friend can freeze assets in escrow for years.
A robust syndicate agreement begins with a definitive roster of participants. This document must record each member’s legal name, government identification details, and exact percentage of ownership. The agreement must state unambiguously that the syndicate operates as an unincorporated association or limited liability partnership formed solely for the purpose of joint lottery participation, and that any ticket purchased by the designated manager within the agreed parameters is the collective property of the entity, not the individual who physically bought it.
Equally critical are the rules governing contribution deadlines. One of the most common legal disputes occurs when an irregular member fails to pay on time, a winning ticket is struck, and the individual claims they had an implicit verbal credit extension. Your charter must state unequivocally: no payment by the specified cutoff time means zero equity in that draw. The syndicate should maintain a strict binary standard that eliminates ambiguity, verbal promises, and post-draw reconciliations.
Financial Logistics and Custodial Protocols
Managing the logistics of a high-performance syndicate requires operational discipline. The group must appoint a syndicate manager who acts as the primary fiduciary. Because this individual bears significant administrative and legal responsibility, their duties, limitations, and protections must be outlined in the syndicate charter.
All financial contributions should flow through a dedicated bank account rather than physical cash exchanges. Modern digital banking provides an immutable electronic ledger detailing precisely who contributed, the exact amount, and the timestamp of the transaction. This electronic trail serves as your primary defense against retroactive ownership claims or tax audits by government revenue authorities.
Once the capital is collected and tickets are purchased, the custodial protocol takes effect. The manager must photograph or scan every ticket prior to the official draw deadline. These digital copies, along with a written manifest listing the specific serial numbers, draw dates, and number combinations, must be distributed electronically to every syndicate member before the winning numbers are pulled. This establishes beyond doubt that the specific tickets in question were purchased with collective funds prior to the drawing, eliminating any accusation that the manager swapped personal tickets for group tickets after the results were known.
Strategic Number Deployment
With funding secured and legal frameworks established, the syndicate must execute its purchasing strategy without relying on random selection. The objective is to maximize combinatorial variance while systematically avoiding common numerical clusters that lead to shared prizes.
The manager should use combinatorial software or pre-calculated wheeling tables to generate the entry lines. This ensures zero accidental duplicates across the group’s portfolio. Furthermore, the selection process should spread numbers across the entire available matrix, deliberately balancing high and low numbers, as well as odd and even distributions. By avoiding sequences that mirror visual patterns on the play slip or calendar dates limited to numbers one through thirty-one, the syndicate protects itself against the risk of splitting a major prize among dozens of other winners who played the same predictable sequences.
In games that offer systematic or combo entries—where a player can pay to play seven, eight, or nine numbers within a single line, automatically generating all combinations of those numbers—syndicates should prioritize these options. Systematic entries simplify administrative tracking, eliminate the clerical error of manual ticket filling, and offer compounding multi-tier payouts when the selected core numbers hit.
Payout Protocols and Tax Architecture
The true test of a syndicate’s operational design occurs after a significant win. Without prior planning, sudden wealth can trigger catastrophic tax complications and structural gridlock. The operating agreement must dictate precisely how payouts are processed, whether through an annuity or a lump-sum distribution, and how tax withholding is allocated across members.
In many jurisdictions, a lottery authority will only issue a single check to a single entity, or they may require specialized group claim forms to split tax obligations among winners. The agreement should stipulate that in the event of a major prize, the manager is authorized to retain a certified legal and accounting team on behalf of the syndicate, paid from the gross proceeds, before any distributions are calculated. This protects all members from personal liability and ensures that tax reporting matches the actual ownership percentages.
For lower-tier winnings, the syndicate must have clear rules regarding reinvestment versus distribution. A common operational standard is to automatically reinvest all payouts below a specific dollar threshold into the syndicate treasury for the next eligible drawing, while distributing any prize exceeding that threshold directly to members based on their equity stake. This policy prevents administrative friction over trivial amounts while keeping the group’s purchasing momentum intact.
Building an enduring, high-performance syndicate is an exercise in professional organization. By treating the endeavor with the seriousness of an investment fund—anchored by statistical design, legal contracts, and transparent protocols—you remove the personal liabilities that ruin informal groups. What remains is a powerful, calculated apparatus designed to capture lottery odds at a scale no lone player could ever achieve.
—
Chapter 7: Strategy 6: Demystifying Frequency Tracking and Hot/Cold Fallacies
Every week, millions of lottery players open spreadsheets, pore over historical draw archives, or launch specialized prediction software. They study multicolored charts displaying hot numbers that have appeared frequently over the past fifty draws, and cold numbers that seem mysteriously absent. The underlying assumption feels intuitive: numbers that have hit repeatedly must carry positive momentum, or conversely, numbers that have remained dormant for months must finally be due to strike.
This reliance on past performance is one of the most persistent and expensive traps in the world of gaming. To build a disciplined, cost-effective lottery approach, you must dismantle the myth of frequency tracking and examine draw histories through a rigorous, empirical lens.
The Myth of Mechanical Memory
The cornerstone of all frequency analysis is the belief that past outcomes exert some influence over future events. In mathematics, this misconception divides neatly into two psychological distortions: the hot-hand fallacy and the gambler’s fallacy.
A player seduced by the hot-hand fallacy believes that a ball drawn four times in three weeks possesses an inherent momentum. A player trapped by the gambler’s fallacy assumes that because a number has not appeared in twenty drawings, the universe must intervene to correct the statistical imbalance.
Both beliefs collapse under the foundational law of probability: independent trials. In any standard lottery drawing, whether conducted via mechanical air-mix machines, gravity-pick units, or certified random number generators, the mechanism possesses zero memory. A numbered rubber ball has no awareness of where it rested during the previous draw, nor does it feel an obligation to restore balance to a human spreadsheet. Each drawing resets the probabilities to their baseline. If the number 17 has a one-in-fifty chance of being drawn tonight, it will have precisely that same one-in-fifty chance next week, regardless of whether it appeared yesterday or has remained unselected for an entire calendar year.
The Industry of False Precision
The human brain is an evolved pattern-recognition engine. When confronted with genuine randomness, our neural architecture actively resists the absence of meaning, searching instead for cycles, rhythms, and trends. Commercial software vendors capitalize aggressively on this cognitive vulnerability.
An entire sub-industry sells proprietary algorithms, wheeling filters, and frequency-tracking platforms that promise to unlock hidden patterns in historical drawings. These programs present historical data using sophisticated data visualization, moving averages, and pseudo-scientific terminology like delta variance and rhythmic frequency.
Yet beneath the polished interfaces, these tools merely catalog the past. They do not forecast the future. When vendors claim their systems have predicted historical jackpots, they are engaging in retrospective fitting. Any sufficiently complex formula can be adjusted backward to match past data points. The fatal flaw appears the moment the system is applied prospectively to an unplayed draw, where its predictive accuracy drops instantly back to base probability. Paying monthly subscriptions or upfront software fees for historical draw analysis does not improve your odds; it simply increases the cost of your participation.
Understanding Random Variance
Why, then, do historical charts reveal such dramatic differences between hot and cold numbers? If every number has an equal probability, should they not all appear with equal frequency?
The answer lies in the distinction between short-term variance and long-term equilibrium. In a small sample size—such as a year or even a decade of lottery draws—randomness inherently clusters. If you flip a balanced coin one hundred times, you will almost certainly encounter streaks of five, six, or seven consecutive heads. These streaks do not indicate a defective coin; they are the natural signature of random distribution.
A standard lottery draws only a few hundred balls each year across its bi-weekly or tri-weekly schedules. Mathematically, a few hundred draws constitute an infinitesimal sample. Within such a compressed timeframe, wide statistical variance is guaranteed. Some numbers will appear to surge ahead, while others lag behind. What frequency trackers label as hot or cold is merely the visible footprint of ordinary, healthy randomness playing out across an inadequate sample size.
Dilution Versus Compensation
A frequent counterargument relies on the Law of Large Numbers, which states that as the number of trials increases, the actual results will converge toward the expected theoretical probability. If this law is absolute, must cold numbers not accelerate to catch up with their hotter counterparts?
The misunderstanding here involves the difference between compensation and dilution. The Law of Large Numbers works through dilution, never through compensation.
Suppose that after one thousand draws, the number 7 has appeared twenty fewer times than expected. The universe will not compensate by drawing the number 7 more frequently over the next fifty draws to balance the ledger. Instead, as the game continues over tens of thousands or hundreds of thousands of draws, those initial twenty missing appearances become statistically negligible. The deficit is diluted into insignificance by the sheer volume of future independent trials. The historical gap is never made up; it is simply drowned out by time.
Mechanical Anomalies and Modern Audits
Advocates of physical tracking often point to historical instances where mechanical imperfections actually created non-random bias. In the twentieth century, several famous syndicates successfully exploited roulette wheels and primitive lottery hardware by tracking thousands of spins to identify warped wood, uneven frets, or imbalanced ball weights.
While mechanical bias is theoretically possible in physical systems, modern lottery operations operate under forensic oversight designed specifically to eliminate it. Modern lottery balls are manufactured to microgram tolerances using specialized foam or elastomer compounds that resist wear and absorption. Ball sets are weighed and measured on calibrated analytical balances before and after drawings under the supervision of independent auditing firms.
Furthermore, state and national lotteries utilize multiple interchangeable ball sets and several identical draw machines, rotating them at random immediately before each broadcast. A set of balls drawn on Tuesday may not be paired with that same machine again for months. This systematic rotation destroys the continuous operational baseline required for any minute mechanical anomaly to manifest as an exploitable trend. Attempting to track physical wear across modern lottery equipment is an exercise in futility.
The Real Utility of Historical Data
Historical draw charts are entirely useless for predicting which numbers will emerge from the machine. However, historical data can serve one genuine, mathematically sound purpose: tracking human behavior rather than mechanical performance.
While lottery machines generate true randomness, human beings do not. When players select their own numbers, they exhibit severe, predictable biases. They heavily favor calendar dates between 1 and 31, gravitate toward lucky numbers like 7 and 11, avoid consecutive digits, and create symmetrical visual patterns on the play slip.
By examining past drawings where jackpots were split among multiple winning tickets, you can observe the real-world consequence of human clustering. The machine does not care which combinations are chosen, but the prize distribution system certainly does.
If you choose to consult draw records, do not look for the numbers the machine prefers. Look instead at the combinations human players routinely avoid. Selecting combinations that fall outside common demographic patterns—such as high numbers beyond 31, adjacent numbers, or seemingly unstructured distributions—does not make your ticket more likely to be drawn. What it does ensure is that if your combination does match, you drastically reduce the statistical likelihood of sharing the prize with dozens of other players.
Directing Capital Where It Counts
Chasing hot numbers and awaiting cold recoveries are comforting rituals because they offer the illusion of control within an inherently uncontrollable environment. Yet discipline requires facing the mathematics directly.
Every dollar diverted into frequency software, tracking books, or elaborate historical analysis systems is capital wasted on pseudoscience. The machine will draw what it draws, entirely unbound by what occurred yesterday or ten years ago. By shedding these tracking fallacies, you free your capital and your focus, anchoring your play in the only metrics that actually govern the game: pure probability, budget preservation, and the strategic avoidance of shared jackpots.
—
Chapter 8: Strategy 7: The Systematic Box Bet Technique in Daily Numbers Games
While millions of hopeful players fixate on multi-state jackpot games offering astronomical sums against odds of one in three hundred million, professional lottery analysts direct their attention toward a far more manageable arena. Daily numbers games, universally known as Pick 3, Pick 4, Cash 3, or Daily 4, operate on entirely different mathematical foundations. In these localized environments, the total universe of possible outcomes shrinks from hundreds of millions down to a mere one thousand combinations for three-digit games, and ten thousand for four-digit games.
This drastic reduction in scale fundamentally transforms the game. The objective shifts from chasing lightning-strike jackpots to engineering structured, lower-variance systems that capture predictable returns. Success in daily numbers does not depend on miraculous luck, but on tactical ticket structuring. By replacing high-risk straight wagers with systematic box bets, hybrid combinations, and positional pair hedging, you can manipulate the probability curve in your favor, smoothing out volatility and generating consistent cash flow.
Understanding the Mechanics of Box Betting
A straight bet demands absolute perfection: your selected numbers must match the winning digits in the exact order drawn. In a three-digit game, a straight bet offers a one in one thousand chance of winning, typically yielding a fixed payout of five hundred dollars on a one-dollar wager. While the payout ratio is attractive, the failure rate is ninety-nine point nine percent per draw. Long losing streaks are practically guaranteed, rapidly depleting a recreational bankroll.
A box bet removes the constraint of sequence. By wagering that your chosen digits will appear in any order, you convert a single ticket into a net that catches multiple permutations. The mathematical expansion of your coverage depends on whether your selected numbers contain unique or duplicate digits.
When you select three distinct digits, such as four, seven, and nine, you create a six-way box. There are six possible permutations of these three digits: 479, 497, 749, 794, 947, and 974. Consequently, your probability of securing a win jumps from one in one thousand to six in one thousand, or one in one hundred sixty-six point seven. In exchange for multiplying your odds of winning by six, the payout adjusts downward, generally settling around eighty dollars for a one-dollar ticket.
If your selection contains two identical digits, such as three, three, and eight, the ticket becomes a three-way box. The possible permutations are 338, 383, and 833. Here, your odds are three in one thousand, or one in three hundred thirty-three point three, with a payout typically hovering around one hundred sixty dollars.
In four-digit games, the box mechanism scales even further. Four distinct digits generate a twenty-four-way box, cutting your odds down from one in ten thousand to one in four hundred sixteen point seven. Selections with pairs, three of a kind, or two distinct pairs generate twelve-way, four-way, and six-way boxes respectively. The trade-off remains constant across all formats: you sacrifice top-line payout magnitude to dramatically compress the mathematical distance between wins.
The Straight Box Hybrid Strategy
While pure box betting dramatically reduces variance, disciplined players often seek a structural balance between high hit frequency and premium returns. This balance is achieved through the straight box combination wager, commonly referred to as a fifty-fifty or split ticket.
A straight box wager splits a single unit bet into two equal components: half on the straight outcome, and half on the box outcome. For example, a one-dollar wager on a three-digit straight box allocates fifty cents to the exact sequence and fifty cents to any order.
This configuration creates a dual-layered payout matrix. If your chosen digits are drawn in an alternate order, your straight half loses, but your box half cashes, returning a modest win that covers your total ticket cost and leaves a respectable profit margin. If the digits appear in the precise sequence you selected, both halves of the ticket win simultaneously. You collect the fifty-cent straight payout combined with the fifty-cent box payout.
The power of this hybrid approach lies in its capital preservation efficiency. In standard straight play, coming close yields zero return; selecting 479 when 749 is drawn results in a total loss of the stake. Under a straight box architecture, that same near-miss functions as an insurance liquidation, keeping your active bankroll fully funded while maintaining active upside exposure for the exact match.
Position Engineering Through Pair Bets
For players who prefer to operate at the absolute lowest variance levels, daily numbers games provide another powerful yet underutilized mechanism: front pairs and back pairs. Pair betting isolates two specific positions within the draw, entirely ignoring the remaining digits.
A front pair bet on a three-digit game requires you to accurately predict the first two digits drawn, in exact sequence. A back pair bet requires matching the final two digits. Because you are predicting only two numbers between zero and nine, the universe of possible combinations is precisely one hundred, from 00 to 99.
The odds of hitting a pair bet are one in one hundred. On a standard one-dollar wager, a winning pair pays fifty dollars. This represents an exceptionally tight mathematical spread in the lottery universe. Experienced players leverage pair wagers in several specific operational roles.
First, pairs serve as foundational stabilizers within a wider portfolio. When tracking digit frequency patterns and positional distributions over fifty or one hundred draws, certain digits frequently demonstrate localized concentration in specific slots. Backing a primary three-digit box ticket with a corresponding front pair hedge ensures that if the broader combination breaks down, the positional momentum of the leading digits can still trigger a break-even event.
Second, pairs can be deployed as independent, high-velocity trading units. Rather than chasing the volatility of full digit sets, an accumulator strategy focuses entirely on high-probability pair cycles, reinvesting profits systematically while keeping draw-down limits tightly governed.
Structuring a Systematic Daily Portfolio
Relying on random individual box tickets undermines the mathematical advantage of the format. To truly lower variance, box betting must be applied systematically across a structured ticket portfolio.
The core principle of a systematic portfolio is permutation clustering. Rather than selecting three completely disconnected numbers across multiple tickets, you build around a selected digit pool. For instance, selecting four target digits—such as two, five, seven, and eight—allows you to generate the complete cluster of four unique three-digit combinations: 257, 258, 278, and 578.
By wagering a six-way box on each of these four combinations, your ticket package covers twenty-four of the one thousand possible outcomes in the draw. Your collective probability of winning on that single draw improves to roughly one in forty-one point six. If any three of your four chosen digits emerge, one of your tickets is guaranteed to cash.
When constructing your portfolio, you must calculate your aggregate cost against the expected recovery value. In the four-ticket cluster example, your total daily layout is four dollars. A single six-way box win pays approximately eighty dollars, representing a twenty-fold return on your daily operational spend. This generous payout multiple allows you to sustain multiple draws without a hit while remaining comfortably in positive territory when a target cluster connects.
Managing Drawdowns and Bankroll Discipline
The greatest danger in daily numbers play is the deceptive simplicity of the games. Because drawings take place once or twice every single day, capital can erode rapidly if wagers are placed impulsively or without strict volume controls.
To execute the systematic box technique effectively, you must establish an uncompromising unit-based bankroll. A single unit should represent your baseline wager for one combination. Your total capital reserve for a daily numbers campaign should equal at least one hundred and fifty units. If your standard wager per ticket is one dollar, your starting bankroll must be one hundred and fifty dollars, dedicated exclusively to this system.
Avoid the temptation to chase losses through aggressive staking escalations, such as doubling your wager after a missed draw. Daily games possess an independent probability on every single drawing; the machine retains no memory of yesterday’s numbers. Increasing bet sizing to compensate for a dry spell dramatically amplifies variance, directly contradicting the core philosophy of box betting.
Log every wager, payout, and sequence variant in an operational ledger. Record the date, the specific game format, the chosen digits, the bet classification—whether six-way box, three-way box, hybrid, or pair—and the financial outcome. Tracking these metrics removes emotion from your play and reveals clear statistical trends regarding which permutation structures perform most efficiently within your regional state lottery matrix.
The Professional Perspective
The systematic box bet technique does not promise overnight wealth, nor does it eliminate the inherent mathematical edge retained by the lottery operator. What it achieves is far more practical: it neutralizes catastrophic variance, maximizes positional hit rates, and systematically preserves your operational capital.
By trading away the remote dream of multi-million-dollar jackpots in exchange for the predictable mechanics of daily numbers games, you transition from a passive gambler into a calculated player. When executed with emotional detachment, precise portfolio coverage, and disciplined bankroll governance, the box betting method establishes a steady, controlled framework designed to yield regular cash returns over the long arc of probability.
—
Chapter 9: Strategy 8: Systematic Exploitation of Second-Chance Drawings
Every afternoon, beside lottery kiosks and convenience store counters across the globe, thousands of dollars in real mathematical equity are dropped into the trash. Players purchase scratch-off tickets or draw slips, quickly scan the primary outcome, and upon discovering they have not won the immediate jackpot, discard the paper. To the untrained eye, this slip of paper is merely litter, an exhausted receipt of a failed wager. To the disciplined, mathematically minded player, however, that discarded slip represents an undervalued financial instrument.
The vast majority of contemporary lotteries operate structured second-chance drawings and integrated loyalty programs. These systems allow players to submit non-winning tickets into subsequent drawings for cash prizes, vehicles, luxury travel, or substantial merchandise portfolios. Because these secondary opportunities require an extra layer of effort, the general public largely ignores them. This pervasive human laziness creates a massive market inefficiency, shifting the probability curve significantly in favor of the systematic participant.
The Mathematics of the Uncontested Pool
In primary lottery drawings, whether scratch-off games or multi-state drawings, the odds are mathematically static and universally dismal. A game might offer a one in four million shot at a top prize, and no behavior on the part of the purchaser can change the underlying distribution of winning tickets printed by the mint or drawn from the hopper. The expected value remains deeply negative because millions of tickets compete for a fixed prize structure.
Second-chance drawings invert this dynamic. In a secondary drawing, the odds of winning are not predetermined by the total number of tickets printed; they are strictly determined by the total number of entries actually submitted. If an agency prints ten million scratch-off tickets for a specific game, but only fifty thousand non-winning tickets are registered into the promotional second-chance pool, the effective odds of capturing the secondary prize pool are dictated entirely by that fifty-thousand-entry denominator.
This drop in the denominator creates participation arbitrage. Lottery executives privately acknowledge that the participation rate for second-chance drawings typically hovers between one and five percent of total eligible tickets sold. When ninety-five percent of the playing public waives their right to enter, they effectively surrender their share of the prize pool to the five percent who take the time to submit. For the systematic player, this dramatically compresses the odds, elevating the expected return per entry far above what was available on the primary ticket face.
The Anatomy of Modern Loyalty Portals
Secondary drawings are no longer the cumbersome, mail-in operations of decades past. Modern lottery corporations have transitioned almost entirely to digital applications and loyalty web portals. These ecosystems serve a dual purpose for the lottery: they collect consumer data and encourage brand retention. In doing so, they provide the sophisticated participant with high-speed tools designed to capture value efficiently.
Within these ecosystems, tickets generally provide two distinct avenues of value. The first is direct drawing entry, where each non-winning barcode corresponds to a single entry—or a variable number of entries weighted by ticket denomination—into a specific sweepstakes. The second is loyalty point accumulation, where tickets generate points that can be redeemed in online storefronts for physical products, gift cards, or entries into rolling cash drawings.
When evaluated purely as a cash-flow system, these portals offer a form of rebate on loss. If a player spends fifty dollars on primary wagers and systematically scans all non-winning inventory, the resulting loyalty points and drawing tickets reduce the net loss profile of the aggregate session. Over thousands of data points, these secondary rebates compress the house edge, turning an otherwise unsustainable negative-expectation game into an environment where strategic timing can produce positive mathematical spikes.
Exploiting Drawing Structures and Timelines
To systematically capture value from second-chance programs, one must understand how lottery operators schedule and partition their drawings. Secondary drawings are rarely held as a single monolithic event; they are typically structured as tiered, rolling contests spread across the lifecycle of a particular scratch game or promotional season.
A standard scratch-off promotional cycle might feature four distinct drawing dates over twelve months, each distributing identical prize packages. The volume of entries across these four dates is rarely uniform. Entry volumes are historically highest during the initial launch phase of the game, when marketing campaigns are active, and in the final drawing phase, when players rush to clear out accumulated inventory before the game expires.
The middle drawing periods routinely suffer from substantial entry deficits. Because the prize pool remains identical regardless of submission volume, submitting entries during these quiet midpoint intervals maximizes your personal share of the pool. A calculated entrant will hold inventory until these low-volume periods occur, submitting bulk entries precisely when the total competitive field is at its mathematical nadir.
Acquiring Non-Winning Inventory Without Capital Expenditure
While standard lottery play requires purchasing tickets directly, second-chance mechanics allow for an asymmetric acquisition strategy: you do not necessarily need to have purchased the ticket to enter it. Lottery rules invariably state that the possessor of the eligible ticket or code may enter it into the registered account, provided the physical ticket was lawfully acquired.
This creates an opportunity for zero-capital inventory sourcing. Non-winning tickets are frequently abandoned directly atop self-service lottery vending machines, left on retailer counters, or dropped in clean disposal bins designated for recycled paper near lottery terminals. In jurisdictions where collecting discarded paper from retail spaces is fully compliant with store policies and local laws, systematic collectors routinely harvest hundreds of discarded entries each week.
This activity eliminates the standard cost of lottery participation. If an entrant submits one thousand second-chance entries sourced entirely from discarded slips, their net financial outlay is zero, yet their claim on the secondary prize fund is real. In this operational model, the expected value shifts from negative to unconditionally positive. The only variable expended is the time required to gather and scan the barcodes.
Risk Management and Procedural Compliance
Systematic participation in second-chance systems demands rigorous adherence to regulatory guidelines. Lottery commissions are state-run entities with strict audit controls, and any perceived breach of terms can result in the immediate forfeiture of prizes.
The most critical operational requirement involves physical ticket retention. While most modern lottery portals allow digital scanning through a smartphone camera, several jurisdictions maintain clauses requiring the winner to present the original, physical non-winning ticket upon claiming a major secondary prize. Discarding the paper slip after scanning can turn a winning draw into a disqualified entry. A disciplined player must establish a systematic filing protocol, storing scanned tickets in labeled batches organized by entry date and game number until the official drawing concludes and all winners are vetted.
Account integrity is equally vital. Creating multiple accounts under pseudonyms to bypass entry caps violates lottery terms of service in virtually every jurisdiction. Modern fraud detection algorithms readily cross-reference bank accounts, Internet Protocol addresses, and geographic location data. Winning entries discovered to originate from duplicate accounts held by the same individual are routinely voided. Systematic value extraction relies on exploiting structural rules, never on attempting to deceive the regulatory system.
Transforming Friction into Profit
The fundamental reason second-chance drawings remain profitable for strategic players is friction. In consumer economics, friction is any step in a process that requires effort, patience, or cognitive attention. The broader lottery demographic is notoriously averse to friction; they play primarily for instant emotional gratification. The requirement to download an app, create a profile, scan a code, and wait three months for a drawing introduces sufficient friction to repel the masses.
For the serious strategist, friction is not an obstacle; it is the protective moat that preserves the edge. The higher the barrier to entry, the fewer the competitors, and the richer the distribution of mathematical value becomes. By viewing non-winning lottery paper as an uncollected dividend rather than discarded rubbish, the systematic player operates in an entirely different financial reality than the casual gambler, turning public indifference into personal probability.
—
Chapter 10: Strategy 9: Scratch-Off Inventory Auditing and Remaining Prize Tracking
Most participants treat instant scratch-off tickets as games of pure chance, indistinguishable from the spin of a roulette wheel. They walk into a convenience store, visually scan the display case, and choose a ticket based on its price point, bright graphics, or a superstitious whim. This approach guarantees long-term financial loss. Scratch-off tickets are fundamentally different from draw games. While a draw game resets its odds with every independent drawing, scratch-off games exist as a strictly finite, physical pool of inventory governed by fixed distribution mathematics.
Every scratch-off game launched by a state lottery commission is manufactured in a predetermined print run. A specific number of tickets are printed, containing an exact, non-negotiable allocation of prizes across various tiers, from free tickets to multi-million-dollar jackpots. Because the pool is finite, the odds of winning a top prize shift continuously from the moment the first ticket is sold until the game is retired. By monitoring public lottery data, an observant player can determine whether the remaining pool of tickets holds a mathematically advantageous concentration of top prizes or has been stripped of its primary value.
The Reality of Finite Inventory
To understand how inventory auditing works, imagine a standard deck of fifty-two playing cards. If you are dealt four cards and none of them are aces, the probability of the fifth card being an ace has mathematically increased because the remaining pool is smaller, yet all four aces remain in play. Conversely, if the first four cards dealt are all aces, the probability of drawing an ace on the fifth card collapses to zero, even though forty-eight cards remain in the deck.
Scratch-off games operate on the exact same structural principle, simply scaled up to millions of tickets. A state might commission a run of twenty million tickets for a thirty-dollar game, embedding ten top prizes of five million dollars each. As consumers purchase and scratch those tickets, prizes are claimed and registered with the state lottery office. If ten million tickets are sold and eight top prizes have already been claimed, the remaining ten million tickets are substantially degraded in overall expected value. The casual player who buys a ticket on that day is paying full retail price for a product whose most lucrative assets have already been largely extracted.
Navigating Official Claim Reports
Lottery commissions are legally required to maintain transparency with the public. To fulfill this regulatory obligation, virtually every state lottery publishes a daily, publicly accessible prize claim report on its official website. These reports are typically categorized under tabs labeled scratcher information, remaining prizes, or game status.
When you access these tables, you will see a detailed inventory breakdown for every active game currently in retail circulation. The most critical data points displayed include the game name, ticket cost, total number of prizes originally printed in each tier, and the exact number of prizes that have been officially claimed or validated to date. By subtracting the claimed prizes from the total printed prizes, the report reveals precisely how many grand prizes and second-tier prizes remain unclaimed.
It is vital to understand the operational lag inherent in these reports. Most state lottery databases update their remaining prize counts once every twenty-four hours, usually overnight. A prize is counted as claimed only when the winning ticket is presented at a district claim center and authenticated by lottery officials. While there is a slight temporal delay between a player discovering a winning ticket and claiming it at headquarters, tracking these tables over weeks and months provides an exceptionally accurate picture of game inventory dynamics.
Calculating Statistical Prize Density
Auditing scratch-off games requires calculating the ratio between the estimated percentage of remaining unsold tickets and the percentage of remaining top prizes. While state websites always show the exact number of remaining prizes, they do not always state the exact number of unsold tickets. However, this figure can be calculated or closely approximated.
In some jurisdictions, the lottery publishes the estimated percentage of total game tickets sold alongside the prize counts. Where this is not explicitly published, you can deduce the overall rate of ticket consumption by tracking the redemption rates of lower-tier, high-volume prizes, such as fifty-dollar or one-hundred-dollar payouts. Because these lower prizes are distributed evenly across print runs and are redeemed rapidly at local retailers, their redemption percentage directly mirrors the total percentage of tickets sold across the state.
Once you have these figures, you evaluate the prize density. If sixty percent of the tickets for a particular game have been sold, but seventy percent of the top prizes have already been validated, the game is depleted; the concentration of top prizes in the remaining field is lower than it was on day one.
The ideal scenario occurs when the inverse takes place. If sixty percent of the tickets have been sold, yet eight out of ten top prizes remain unclaimed, the remaining ticket inventory has an over-concentration of grand prizes. In this situation, the statistical density of top prizes has increased significantly compared to the original print run. You are no longer buying into the standard baseline odds; you are buying into an artificially concentrated pool where your dollar has substantially more leverage toward securing a top-tier return.
Eliminating Dead Games
The most immediate practical benefit of inventory auditing is the complete elimination of dead game purchases. A dead game is a scratch-off that remains on retail display racks despite having all of its top-tier prizes already claimed.
Many players assume that when the final grand prize of a scratch-off game is won, the state lottery immediately recalls the remaining tickets from store counters. In reality, state lotteries routinely allow retailers to continue selling depleted games for weeks or even months after the top prizes are gone, provided there are still secondary or tertiary prizes available. Retail clerks have no insight into these prize counts and will happily sell you a ticket for a game that mathematically cannot produce the jackpot advertised on the cardboard display.
Purchasing a scratch-off ticket after the top prizes have been zeroed out permanently destroys your long-term expected value. You are accepting the full downside of the game’s built-in negative expectation without retaining the single mathematical outcome that justifies the purchase. A daily audit of state reports ensures that you never spend a single dollar on a compromised game.
Retail Auditing and Pack Dynamics
Once you identify an over-concentrated game on the state registry, the next phase involves physical retail tracking. Scratch-off tickets are delivered to retailers in sealed, plastic-wrapped packs, often called books or rolls. Each pack contains a fixed dollar value of tickets, and every individual ticket features a unique serial number printed on the back.
This serial number contains vital information: the game number, the pack number, and the ticket number within that specific pack. For example, a three-digit game code is followed by a unique six-digit pack code, followed by a two-digit ticket sequence number showing its place in the roll.
By observing these numbers across several regular retail visits, a systematic player can track local turnover. You can observe how quickly a store sells through a specific roll and identify when a store opens a new pack from its back-room safe. While pack-level variance does not guarantee a jackpot in any individual roll, ensuring that your target game is moving actively through high-volume retail locations guarantees you are purchasing fresh inventory that aligns with current state claim reports, rather than ancient, stagnant stock that might predate recent prize validations.
The Disciplined Execution Routine
Successful execution of an inventory audit strategy requires unwavering operational discipline. It demands that you treat the lottery counter not as an impulse entertainment venue, but as a dynamic marketplace where inventory values fluctuate daily.
Begin by establishing an auditing schedule. Check your state lottery’s official prize claim page once or twice per week, recording the remaining prize metrics for games at your preferred price points in a simple spreadsheet. Calculate the prize retention ratio for each game by dividing the percentage of remaining top prizes by the percentage of remaining total tickets.
Rank every active game by this metric. When all games sit at or below baseline odds, you make zero purchases. You preserve your capital. Only when an anomaly surfaces—where a game exhibits a major statistical imbalance with top prizes heavily over-represented relative to depleted inventory—do you deploy your designated budget.
By relying on verified state reporting rather than visual appeal, you transition from a passive consumer to an informed market participant. You eliminate the mathematical traps of dead games, exploit rare structural imbalances in remaining inventory, and ensure that every ticket you scratch represents the highest statistical probability available in the system.
—
Chapter 11: Strategy 10: Strict Bankroll Management and Kelly Criterion Application
The single greatest divider between a reckless gambler and a disciplined speculator is not intuition, luck, or game selection. It is capital preservation. Every professional trading desk, quantitative hedge fund, and professional bettor operates under a foundational truth: if you exhaust your operating capital, your mathematical edge evaporates immediately. When applied to multi-state lotteries and large-scale sweepstakes, this principle becomes even more vital. Because the variance in lottery gaming is the most extreme of any speculative market on Earth, survival over extended periods requires a rigid framework that prevents emotional decisions and catastrophic losses.
Most lottery players treat their ticket purchases as casual, uncalculated transactions. They spend surplus cash when they feel lucky or dramatically increase their purchase volume when a rollover reaches historical proportions. This erratic behavior guarantees that losses accumulate invisibly over time, skewing personal finances without providing any strategic advantage. To approach the lottery with analytical rigor, you must treat your capital not as disposable pocket change, but as an allocated speculative fund with explicit, non-negotiable operational boundaries.
The Mathematics of Capital Allocation
In 1956, Bell Labs researcher John L. Kelly Jr. introduced a formula designed to maximize the long-term growth rate of capital when faced with favorable speculative opportunities. Known across finance and game theory as the Kelly Criterion, the formula calculates the exact percentage of an existing bankroll that should be committed to a single wager based on the probability of winning and the net odds received.
In traditional betting environments, the formula seeks the optimal balance between aggressive capital growth and the absolute prevention of ruin. If your edge is substantial and the odds are short, the formula advises committing a meaningful fraction of your funds. Conversely, as the probability drops or the edge shrinks, the recommended allocation rapidly diminishes toward zero.
The immediate problem when applying the Kelly Criterion to massive multi-state lotteries is the extreme nature of the odds. When the probability of success is one in three hundred million, standard formulations break down conceptually for ordinary players. If a jackpot reaches a theoretical mathematical point of positive expectation—taking into account massive rollovers and tax liabilities—a strict, unmodified Kelly calculation might suggest allocating a visible percentage of your net worth to capture that edge. In the real world, doing so would represent financial madness. The sheer distance between independent trials means an individual could wager their entire life savings over a dozen generational jackpots and still face a statistical probability of ruin exceeding ninety-nine percent.
The Modified Fractional Kelly Approach
To reconcile the mathematical elegance of Kelly with the brutal realities of multi-million-to-one odds, serious analysts turn to fractional and modified Kelly models. Instead of executing a full Kelly stake, institutional risk managers frequently employ Half-Kelly, Quarter-Kelly, or micro-fractional adaptations. In the context of the lottery, we adapt the formula not to maximize compounding growth, but to establish an impenetrable ceiling on exposure during high-value market conditions.
A modified Kelly calculation for lottery play operates under a dual constraint. First, it requires an estimated positive expectation, which generally only occurs when rollovers climb high enough to overcome the structural house edge, even after accounting for split-jackpot probabilities and tax deductions. Second, it enforces a micro-fractional cap that prevents any single drawing from claiming more than a minuscule fraction of your dedicated entertainment or speculative capital.
Under this modified model, your wager size does not scale with excitement; it scales exclusively with mathematical margin. If a drawing offers no statistical edge, the Kelly recommendation is zero. Under zero-edge or negative-expectation conditions, purchasing a ticket is mathematically defined as paying for sheer recreational value rather than executing an investment strategy. If a massive rollover briefly tips the theoretical value into positive territory, the modified formula dictates an allocation that never exceeds a predetermined fraction of one percent of your earmarked bankroll.
Constructing the Dedicated Bankroll
Before you can calculate fractions, you must establish the entity from which those fractions are drawn. A lottery bankroll must be completely divorced from personal, household, and essential savings capital. It cannot be funded with money needed for living expenses, debt retirement, emergency reserves, or long-term retirement investments. It must exist as a fully firewalled pool of discretionary capital.
The construction of this bankroll begins with an annual allocation. By setting aside a predetermined sum at the start of a twelve-month cycle, you convert lottery spending from an open-ended drain into a capped, predictable cost center. Once this capital is transferred into your lottery tracking ledger, it is treated as already spent in terms of household budgeting.
This psychological firewall changes your entire relationship with the game. When ticket purchases are funded from general cash flow, losses go unmonitored, creating a false sense of minimal expenditure. When every dollar spent visibly diminishes a finite, dedicated account, your awareness of capital depletion sharpens. More importantly, it imposes an automatic stop-loss mechanism. If the dedicated bankroll reaches zero before the annual cycle concludes, all purchasing halts entirely until the next calendar period. There are no exceptions, emergency injections, or temporary loans from other accounts.
Definitive Allocation Rules
To operationalize bankroll management, you must adhere to two absolute spending rules that govern regular and anomalous market conditions.
The base rule governs baseline play during standard jackpot sizes. If you choose to maintain regular participation during normal drawings, your per-drawing outlay must remain at a fixed micro-allocation. For most individual players, this means committing no more than one-tenth of one percent of your annual dedicated bankroll to any standard drawing. If your total yearly allocation is five hundred dollars, a standard drawing expenditure should not exceed two to four dollars. This baseline rule satisfies the objective of participating in the draw without eroding capital during standard, negative-expectation cycles.
The surge rule activates exclusively during massive rollovers that generate public frenzy and mathematically elevated value. When an anomalous jackpot occurs, amateur players dramatically overspend, often depleting their disposable income in a single week. A disciplined practitioner operates differently. Under the surge rule, you are permitted to increase your allocation using your modified Kelly calculation, but never beyond a hard ceiling of five percent of your remaining annual bankroll for that specific drawing sequence.
By capping surge events at five percent of the bankroll, you guarantee that even a catastrophic run of bad outcomes across multiple historic rollovers leaves your core speculative capital intact. You retain the ability to play future high-value anomalies without ever compromising your broader financial health.
Tracking, Audit, and Emotional Discipline
Rigorous bankroll management cannot exist without thorough record-keeping. Every ticket purchased, the date of the drawing, the size of the jackpot, the mathematical conditions present at the time, and the return on investment must be logged in a dedicated ledger.
This tracking process serves a vital behavioral function. Human memory is notoriously selective, prone to remembering secondary tier wins while minimizing the steady accumulation of non-winning tickets. A clean, dispassionate spreadsheet strips away narrative bias and presents your lottery activity with clinical clarity. It reveals your true cost of participation and provides continuous empirical proof of whether your discipline is holding firm.
When you manage your bankroll through cold calculation and rigid limits, you remove hope, anxiety, and desperation from the equation. You accept that in games of extreme variance, you cannot control the outcome of any single drawing. What you can control—with absolute, unyielding precision—is your exposure to ruin. By applying modified capital preservation principles, you ensure that you remain solvent, rational, and fully protected, no matter what the random draw produces.
—
Chapter 12: Strategy 11: Annuity vs. Lump Sum Valuation and Tax Arbitrage
The moment a winning ticket is validated, the fantasy of instantaneous wealth collides with the reality of institutional finance. The figure broadcast on television screens and printed across billboards is an illusion designed for marketing impact rather than balance sheet clarity. What a lottery commission advertises as a half-billion-dollar fortune is, in truth, an aggregate sum of thirty graduated payments financed through zero-coupon United States Treasury bonds. Faced with the choice between an immediate cash distribution and an extended payout schedule, the winner must execute one of the most consequential capital allocation decisions of their life within a strict legal window, typically lasting sixty to one hundred and eighty days.
This decision is not an ideological debate between discipline and instant gratification. It is a mathematical exercise governed by net present value calculations, forward-looking discount rates, persistent inflation, and the structural exploitation of the modern tax code. Choosing incorrectly can destroy tens of millions of dollars in purchasing power before the capital has an opportunity to compound.
The Mechanics of Present Value
To understand the core dilemma, one must look beneath the hood of the jackpot calculation. When a player wins a advertised three-hundred-million-dollar jackpot, the lottery commission does not hold that capital in reserve. Instead, they hold the cash value—often roughly fifty to fifty-five percent of the total figure—and offer to invest it on the winner’s behalf into a portfolio of federal debt obligations that mature incrementally over three decades.
The cash option represents the true present value of the stream of future payments, discounted by prevailing interest rates. If interest rates are high, the bond yield curve is steeper, meaning a smaller lump sum is needed today to guarantee the future multi-million-dollar annuity payments. Conversely, in a low-interest-rate environment, the cash value rises closer to the headline figure because the underlying bonds generate lower compounding yields.
Evaluating this payout requires calculating the hurdle rate: the annualized rate of return the winner must achieve on the net lump sum to equal or exceed the after-tax annuity over thirty years. Historically, balanced investment portfolios composed of diversified global equities, high-grade debt instruments, and real estate have outpaced the internal rate of return embedded within state-sponsored annuities, which generally hovers near the yield of thirty-year Treasuries. Accepting the annuity is effectively allocating your entire net worth into long-term sovereign debt, an ultra-conservative portfolio construct that carries substantial opportunity cost.
The Inflation Trap and Purchasing Power Erosion
While the annuity promises an ironclad shield against complete financial ruin, it exposes the recipient to an insidious, mathematically certain threat: the erosion of real purchasing power. Most modern lotteries structure their annuities with an annual graduated increase, commonly four to five percent per year, designed to offset standard historical inflation. However, this adjustment is rigid and indifferent to broader macroeconomic volatility.
Over a thirty-year horizon, unexpected inflationary cycles can decimate the real value of fixed cash distributions. A payment of ten million dollars received twenty-five years from today will command only a fraction of the goods, labor, and assets it buys at the moment of the draw. Capital deployed immediately into productive assets—such as cash-flowing real estate, operational businesses, and dividend-yielding equities—possesses an intrinsic mechanism to adjust pricing alongside monetary expansion.
The lump sum grants immediate sovereign control over purchasing power. When deployed with institutional discipline, real assets serve as a dynamic hedge against currency debasement, whereas an annuity leaves the recipient trapped inside a fixed nominal schedule, entirely at the mercy of sovereign fiscal and monetary policy.
Navigating the Tax Arbitrage Equation
The prevailing argument for taking an annuity is often rooted in the myth of tax smoothing. Proponents suggest that spreading income over thirty years reduces the total tax burden compared to taking an enormous lump sum subject to the top federal bracket on day one. In practice, this logic fails under rigorous tax analysis.
A modern mega-jackpot is so immense that even divided into thirty tranches, every single annual distribution will vastly exceed the threshold for the highest federal income tax bracket. Spreading the payout does not step the income down into lower brackets; it merely subjects thirty separate checks to the highest marginal rate.
More critically, selecting the annuity locks the winner into thirty years of legislative tax risk. The top marginal federal rate today sits at thirty-seven percent, near historic lows when viewed against the eighty- and ninety-percent top brackets seen in the mid-twentieth century. If Congress raises income taxes in future legislative sessions, every subsequent annuity check is haircut at that higher rate. Taking the lump sum triggers an immediate, monumental tax liability, but it does so under known, locked-in parameters.
Once that initial tax hit is absorbed, the remaining liquid capital transforms from ordinary income into private wealth. Any subsequent growth generated by that capital is no longer taxed as ordinary income; it is instead eligible for preferential long-term capital gains rates, qualified dividend treatment, or deferral through tax-advantaged structures. This transition from ordinary income taxation to capital gains taxation is the fundamental pivot of windfall tax arbitrage.
State Taxation and Jurisdictional Mobility
State-level taxation introduces an additional layer of arbitrage for the strategic winner. Lottery winnings are taxable as ordinary income by the state where the ticket was purchased, regardless of where the winner claims legal residency at the time of the draw. For the initial payout, this liability is unavoidable.
For the annuity recipient, however, many state taxing authorities maintain that future payments remain sourced to the host state, meaning an individual cannot evade ongoing state income taxes simply by relocating to a state without an income tax, such as Texas, Florida, or Nevada. Even worse, if the winning jurisdiction permits, taking thirty years of payments anchors the winner’s tax profile to that specific state’s legislative and budgetary whims for three decades.
The lump sum resolves state liability instantly. After paying the mandatory state withholding and subsequent reconciliation in the year of the win, the investor is entirely free to alter their tax domicile. Moving primary residency to a zero-income-tax state or establishing family asset protection trusts in jurisdictions like Delaware, South Dakota, or Wyoming shields all future investment yield from local taxation forever.
Estate Tax Vulnerabilities and Liquidity Crises
Perhaps the most catastrophic and least understood hazard of the lottery annuity is its treatment under federal estate tax law. If an annuity winner dies in year five of a thirty-year term, the remaining twenty-five payments do not vanish; they pass to their designated beneficiaries or estate. However, the Internal Revenue Service does not wait thirty years to collect estate taxes on that balance.
Under the Internal Revenue Code, the gross estate includes the fair market value of the remaining annuity payments, calculated using the present value of the cash stream at the date of death. This calculation produces an immediate, massive federal estate tax bill—levied at rates up to forty percent on amounts exceeding statutory lifetime exemptions—due within nine months of the decedent’s passing.
Because the underlying asset is an illiquid income stream paid out over decades, the heirs may face a multi-million-dollar tax bill with zero liquidity to satisfy it. Most state lottery commissions do not allow estates to commute the remaining annuity into a lump sum upon death, and attempting to sell the future payments on the secondary factoring market leads to predatory discounts. Families have been pushed into bankruptcy and forced into distressed, heavily discounted third-party sales simply to pay estate taxes on a fortune they have not yet received.
The lump sum, when structured within irrevocable trusts, generation-skipping trusts, and private family offices, grants total flexibility to establish liquidity pools, purchase cross-generational life insurance, and execute gifting programs that insulate future generations from catastrophic wealth transfer liabilities.
The Final Calculus
For an individual who lacks impulse control, possesses zero financial literacy, and refuses to retain a vetted team of fiduciary advisors, tax attorneys, and institutional custodians, the annuity serves a singular, paternalistic function: it prevents total insolvency by limiting annual loss. It provides a financial reboot every twelve months for thirty years.
For anyone committed to optimizing financial reality, the mathematical verdict is unequivocal. The lump sum, combined with immediate debt eradication, defensive asset allocation, geographic tax planning, and strategic trust architecture, outclasses the annuity on virtually every operational metric. It converts marketing collateral into private, sovereign balance sheet liquidity, trading the illusion of a paper jackpot for absolute control over real wealth.
—
Chapter 13: Strategy 12: Cognitive Biases and the Master Strategic Playbook
The human brain is an exquisite pattern-recognition machine, engineered over millennia to detect meaning in chaos. When early humans noticed rustling grass, assuming a predator was present saved their lives, even if the wind was the true culprit. In the realm of probability, however, this survival instinct becomes an active liability. The mechanics of the lottery are entirely indifferent to human psychology, yet players routinely project meaning, narrative, and momentum onto numbers drawn from a rotating drum or generated by a cryptographic algorithm. To elevate your approach from mere hopeful spending to disciplined execution, you must first master the mental architecture that causes most participants to defeat themselves before the draw even takes place.
The Architecture of Self-Deception
The most pervasive trap in games of chance is the near-miss effect. When a ticket matches four out of six numbers, or misses a massive jackpot by a single digit, the brain registers the event not as a total mathematical loss, but as an encouraging proximity to victory. Neuroimaging studies show that near-misses activate the same dopaminergic reward pathways as actual wins. The player feels that their methodology was almost right, prompting them to invest more capital into the next draw.
In pure probability, however, missing a jackpot by one digit carries the exact same mathematical predictive value for the next draw as missing every single number: zero. Every drawing is an independent event with a reset memory. A near-miss is simply an optical illusion created by our emotional attachment to numerical sequencing. Acknowledge the loss as an absolute data point, collect any secondary fixed prize if applicable, and dismiss the psychological urge to view it as progress toward the grand prize.
Closely tied to this phenomenon is the escalation of commitment, commonly understood as the sunk cost fallacy. When an individual spends weeks, months, or years playing a specific combination or funding a persistent ticket pool, an irrational ownership over those specific digits begins to form. The thought of abandoning the sequence produces acute anxiety—the terrifying prospect that the very week they stop playing, the sequence will emerge.
This emotional hostage-taking forces players to allocate increasing sums of money to prevent regret rather than to capitalize on statistical advantage. A professional player recognizes that numbers possess no loyalty, history, or awareness. If a strategy, game format, or combination fails to meet the objective criteria of positive expectation or structural efficiency, it must be discarded immediately without mourning past capital.
The Gambler’s Fallacy completes the triad of common cognitive failures. It manifests as the unshakable conviction that an outcome is due simply because it has not occurred recently. Players scrutinize frequency charts, identify cold numbers that have remained absent for fifty draws, and load their cards with those digits under the assumption that equilibrium must soon be restored. While the law of large numbers guarantees that frequencies balance out over millions of iterations, the timeline required to observe this balance vastly exceeds a human lifetime. The mechanical drum holds no memory of the previous Wednesday. Treating absence as an impending arrival is a fast track to misallocating resources.
The Illusion of Control
A subtle trap that separates recreational ticket buyers from analytical practitioners is the illusion of control. When players are permitted to manually select their numbers, pick their draw dates, or enact personal rituals at the retail terminal, they report a significantly higher subjective confidence in winning than when a computer assigns them a quick-pick ticket.
In truth, selecting your child’s birthday does not alter the underlying combinatorics by a fraction of a percent. In fact, it often depresses the expected financial return because human beings share predictable selection biases, disproportionately choosing numbers between one and thirty-one. The illusion of control flatters your vanity while quietly reducing your prospective payout in the event of a shared jackpot. To operate rationally, you must separate operational control—which involves capital allocation, syndicate formation, and math-driven game selection—from mechanical control over the random draw itself, which is impossible.
Synthesizing the Twelve Strategies
Throughout this work, we have dissected the structural, financial, and analytical levers that govern number games. We explored the mathematical boundaries of odds, the discipline of bankroll sizing, the power of syndicates to capture non-linear coverage, the identification of favorable jackpot rollover thresholds, and the deliberate avoidance of clustered numbers to protect against shared pots. We addressed second-chance drawings, multi-tier prize structures, statistical distribution anomalies, and the systemic elimination of retail friction.
None of these strategies operate at full power in isolation. A player who understands mathematical expected value but lacks emotional discipline will overspend during a jackpot run and exhaust their bankroll prematurely. Conversely, a disciplined saver who plays inefficient combinations during unfavorable draws simply minimizes their losses without maximizing their upside. The twelve strategies are not a menu of isolated tactics; they represent a single, integrated operating system.
The Master Weekly Playbook
To transform these concepts into permanent practice, you must replace haphazard ticket purchases with a systematic weekly cadence. This cadence eliminates emotional decision-making and standardizes every variable under your control.
Phase One: The Game Audit
At the start of each weekly cycle, your objective is not to buy tickets, but to evaluate the landscape. Survey the available lotteries within your legal reach and calculate the current expected value for each. Factor in the advertised jackpot, the estimated tax deduction, the probability of split prizes based on ticket sales volume, and the value of lower-tier payouts.
If no game on the board clears the threshold of mathematical interest or presents an asymmetric rollover state, your decision for the week is simple: execute no transactions. Capital preservation is the cornerstone of professional play. An amateur feels compelled to play every Tuesday and Saturday out of routine; an analytical player waits patiently for the numbers to align in their favor.
Phase Two: Capital Allocation and Pool Structuring
Once an advantageous scenario presents itself, consult your pre-allocated bankroll. This capital must be completely isolated from your daily operating expenses, viewed strictly as venture capital applied to high-variance assets. Under no circumstances should current cash flow dictate ticket volume.
Determine the operational vehicle for the draw. If the jackpot has reached a rare threshold where broad combinatorial coverage provides an edge, activate your syndicate agreements. Ensure that all participant contributions are documented, signed, and locked into contractual pools well before tickets are secured. By formalizing this structure during the calm hours of the week, you eliminate disputes and establish complete clarity on ownership shares.
Phase Three: Ticket Construction
When populating your entries, deploy the distributional rules established in our earlier chapters. Reject purely symmetrical patterns, geometric shapes on play slips, and heavy concentrations of dates that correspond to calendar limits. Balance your high and low integers, monitor odd and even distributions to match historical standard deviations, and use automated combinatorial generation rather than emotional manual selection.
If playing multiple lines, ensure that your numbers systematically maximize coverage across the total field rather than duplicating subsets across cards. Every ticket in your portfolio must fulfill a distinct strategic purpose, widening your net across the prize distribution table rather than concentrating risk on a single localized cluster.
Phase Four: Execution and Verification
Procure entries through channels that minimize human error. Whether utilizing authorized digital courier services where permitted or purchasing through designated retail terminals, immediately secure and document your receipts. Log the transaction details into your personal tracking ledger, noting the game, the total outlay, the structural design of the lines, and the date.
Store physical tickets in a designated, fireproof location or archive digital confirmations immediately. The administrative rigor applied after the purchase must match the intellectual rigor applied before it. A winning ticket that is lost, damaged, or contested due to poor record-keeping yields zero return.
Phase Five: Post-Draw Reconciliation
After the draw has concluded and official winning sequences are verified through authoritative regulatory channels, review the results dispassionately. Check every ticket not only for the primary prize, but for all secondary and tertiary tiers. Many players inadvertently discard winning tickets that carry substantial fixed payouts because they focus entirely on the top jackpot.
Direct all winnings—regardless of size—back into the dedicated bankroll fund rather than absorbing them into personal spending. Record the statistical metrics in your tracking sheet. Review your emotional state during the process: Did you feel anxiety during the draw? Did a near-miss tempt you to immediately double your allocation for the upcoming weekend? Identify these cognitive intrusions and log them as operational hazards to be neutralized in the next cycle.
The Disciplined Mindset
The ultimate advantage in games of extreme variance does not stem from superstition, intuition, or the false comfort of lucky rituals. It is forged in the quiet refusal to fall prey to the psychological fallacies that compromise the average player.
You now hold a comprehensive, mathematically grounded framework that addresses every dimension of the game: from the structural mechanics of the balls in the machine to the emotional circuitry of the mind holding the ticket. By operating with unwavering consistency, respecting the mathematics of capital allocation, and executing the steps of the Master Playbook without deviation, you shift your posture entirely. You cease to be a passive participant hoping for fortune, and become an informed, disciplined operator navigating the landscape of chance with complete clarity and purpose.
—